
Search for Indicators
Opioid Use in Mendocino County
Opioids are natural or synthetic chemicals that bind to receptors in your brain or body. Common opioids include heroin and prescription drugs such as oxycodone, hydrocodone, and fentanyl. Opioid abuse is a serious public health issue, but preventive actions, limiting the number of opioid prescriptions, and treatment for addiction to prevent future use can help.
The majority of drug overdose deaths involve an opioid, and at least half of all opioid overdose deaths involve a prescription opioid. Since 1999, the rate of overdose deaths involving opioids (including prescription opioid pain relievers) nearly quadrupled. According to the CDC, overdoses from prescription opioid pain relievers are a driving factor in the increase in opioid overdose deaths.
Indicator Gauge Icon Legend
Legend Colors
Red is bad, green is good, blue is not statistically different/neutral.
Compared to Distribution
 the value is in the best half of communities.
 the value is in the 2nd worst quarter of communities.
 the value is in the worst quarter of communities.
Compared to Target
 meets target;
  does not meet target.
Compared to a Single Value
 lower than the comparison value;
 higher than the comparison value;
 not statistically different from comparison value.
Trend

 non-significant change over time;
 significant change over time;
  no change over time.
Compared to Prior Value
 higher than the previous measurement period;
 lower than the previous measurement period;
 no statistically different change from previous measurement period.
Health / Alcohol & Drug Use
Age-Adjusted Death Rate due to All Opioid Overdose County: Mendocino
Age-Adjusted Death Rate due to All Opioid Overdose County: Mendocino
54.9
Rate per 100,000 residents
(2022)
Compared to:


CA Counties
The distribution is based on data from 58 California counties.
CA Value
(18.7)
The regional value is compared to the California state value.
Prior Value
(54.7)
Prior Value compares a measured value with the previously measured value. Confidence intervals were not taken into account in determining the direction of the comparison.
Trend
This comparison measures the indicator’s values over multiple time periods.<br>The Mann-Kendall Test for Statistical Significance is used to evaluate the trend<br>over 4 to 10 periods of measure, subject to data availability and comparability.
Health / Alcohol & Drug Use
Age-Adjusted Death Rate due to Prescription Opioid Overdose
Value
Compared to:
Age-Adjusted Death Rate due to Prescription Opioid Overdose County: Mendocino
Age-Adjusted Death Rate due to Prescription Opioid Overdose County: Mendocino
54.9
Rate per 100,000 residents
(2022)
Compared to:
CA Counties
The distribution is based on data from 58 California counties.
CA Value
(18.1)
The regional value is compared to the California state value.
Prior Value
(53.2)
Prior Value compares a measured value with the previously measured value. Confidence intervals were not taken into account in determining the direction of the comparison.
Trend
This comparison measures the indicator’s values over multiple time periods.<br>The Mann-Kendall Test for Statistical Significance is used to evaluate the trend<br>over 4 to 10 periods of measure, subject to data availability and comparability.
Health / Alcohol & Drug Use
Age-Adjusted Death Rate due to Synthetic Opioid Overdose (excluding Methadone)
Value
Compared to:
Age-Adjusted Death Rate due to Synthetic Opioid Overdose (excluding Methadone) County: Mendocino
Age-Adjusted Death Rate due to Synthetic Opioid Overdose (excluding Methadone) County: Mendocino
49.9
Rate per 100,000 residents
(2022)
Compared to:
CA Counties
The distribution is based on data from 58 California counties.
CA Value
(16.7)
The regional value is compared to the California state value.
Prior Value
(49.1)
Prior Value compares a measured value with the previously measured value. Confidence intervals were not taken into account in determining the direction of the comparison.
Trend
This comparison measures the indicator’s values over multiple time periods.<br>The Mann-Kendall Test for Statistical Significance is used to evaluate the trend<br>over 4 to 10 periods of measure, subject to data availability and comparability.
HP 2030 Target
(8.9)
<div>IVP-22: Reduce overdose deaths involving synthetic opioids other than methadone</div>
Health / Alcohol & Drug Use
Age-Adjusted ED Visit Rate due to Opioid Overdose (excluding Heroin)
Value
Compared to:
Age-Adjusted ED Visit Rate due to Opioid Overdose (excluding Heroin) County: Mendocino
Age-Adjusted ED Visit Rate due to Opioid Overdose (excluding Heroin) County: Mendocino
88.2
Rate per 100,000 residents
(2022)
Compared to:

CA Counties
The distribution is based on data from 58 California counties.
CA Value
(54.9)
The regional value is compared to the California state value.
Prior Value
(25.3)
Prior Value compares a measured value with the previously measured value. Confidence intervals were not taken into account in determining the direction of the comparison.
Trend
This comparison measures the indicator’s values over multiple time periods.<br>The Mann-Kendall Test for Statistical Significance is used to evaluate the trend<br>over 4 to 10 periods of measure, subject to data availability and comparability.
Health / Alcohol & Drug Use
Age-Adjusted Hospitalization Rate due to Opioid Overdose (excluding Heroin)
Value
Compared to:
Age-Adjusted Hospitalization Rate due to Opioid Overdose (excluding Heroin) County: Mendocino
Age-Adjusted Hospitalization Rate due to Opioid Overdose (excluding Heroin) County: Mendocino
12.9
Rate per 100,000 residents
(2022)
Compared to:

CA Counties
The distribution is based on data from 58 California counties.
CA Value
(12.1)
The regional value is compared to the California state value.
Prior Value
(25.3)
Prior Value compares a measured value with the previously measured value. Confidence intervals were not taken into account in determining the direction of the comparison.
Trend
This comparison measures the indicator’s values over multiple time periods.<br>The Mann-Kendall Test for Statistical Significance is used to evaluate the trend<br>over 4 to 10 periods of measure, subject to data availability and comparability.
Health / Alcohol & Drug Use
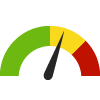
Age-Adjusted Long Acting or Extended Release Opioid Prescription Rate to Opioid Naive Residents
Value
Compared to:
Age-Adjusted Long Acting or Extended Release Opioid Prescription Rate to Opioid Naive Residents County: Mendocino
Age-Adjusted Long Acting or Extended Release Opioid Prescription Rate to Opioid Naive Residents County: Mendocino
3.0
Per 100,000 population
(2022)
Compared to:
CA Counties
The distribution is based on data from 58 California counties.
CA Value
(1.2)
The regional value is compared to the California state value.
Prior Value
(3.6)
Prior Value compares a measured value with the previously measured value. Confidence intervals were taken into account in determining the direction of the comparison.
Trend
This comparison measures the indicator’s values over multiple time periods.<br>The Mann-Kendall Test for Statistical Significance is used to evaluate the trend<br>over 4 to 10 periods of measure, subject to data availability and comparability.
Quarterly Opioid Prescription Rate County: Mendocino
Quarterly Opioid Prescription Rate County: Mendocino
483.2
Prescriptions per 10,000 population
(Q3 2022)
Compared to:
CA Counties
(Q2 2022)
The distribution is based on data from 58 California counties.
Prior Value
(491.0)
Prior Value compares a measured value with the previously measured value. Confidence intervals were not taken into account in determining the direction of the comparison.
Trend
This comparison measures the indicator’s values over multiple time periods.<br>The Mann-Kendall Test for Statistical Significance is used to evaluate the trend<br>over 4 to 10 periods of measure, subject to data availability and comparability.
Opioid Prescription Patients County: Mendocino
Opioid Prescription Patients County: Mendocino
3.7%
(Q3 2022)
Compared to:
CA Counties
(Q2 2022)
The distribution is based on data from 58 California counties.
Prior Value
(3.8%)
Prior Value compares a measured value with the previously measured value. Confidence intervals were not taken into account in determining the direction of the comparison.
Trend
This comparison measures the indicator’s values over multiple time periods.<br>The Mann-Kendall Test for Statistical Significance is used to evaluate the trend<br>over 4 to 10 periods of measure, subject to data availability and comparability.
Age-Adjusted Death Rate due to Heroin Overdose County: Mendocino
Age-Adjusted Death Rate due to Heroin Overdose County: Mendocino
8.6
Deaths per 100,000 population
(2019)
Compared to:
CA Counties
(2018)
The distribution is based on data from 58 California counties.
CA Value
(2.4)
The regional value is compared to the California state value.
Prior Value
(3.4)
Prior Value compares a measured value with the previously measured value. Confidence intervals were not taken into account in determining the direction of the comparison.
Trend
This comparison measures the indicator’s values over multiple time periods.<br>The Mann-Kendall Test for Statistical Significance is used to evaluate the trend<br>over 4 to 10 periods of measure, subject to data availability and comparability.
HP 2030 Target
(4.2)
Age-Adjusted ED Visit Rate due to Heroin Overdose County: Mendocino
Age-Adjusted ED Visit Rate due to Heroin Overdose County: Mendocino
4.3
Rate per 100,000 residents
(2022)
Compared to:
CA Counties
The distribution is based on data from 58 California counties.
CA Value
(3.6)
The regional value is compared to the California state value.
Prior Value
(10.2)
Prior Value compares a measured value with the previously measured value. Confidence intervals were not taken into account in determining the direction of the comparison.
Trend
This comparison measures the indicator’s values over multiple time periods.<br>The Mann-Kendall Test for Statistical Significance is used to evaluate the trend<br>over 4 to 10 periods of measure, subject to data availability and comparability.
