
Search for Indicators
Priority Area: Health Risk Behaviors
The Community Health Needs Survey conducted in 2022 has exposed the concerns of community members in Mendocino County about their family, friends, and coworkers' overall wellbeing. For example, 15.9% of the population smoke tobacco which is a higher rate than in California (11.5%). The teen birth rate is 21.4 per 1000 females, which is greater than the states teen birth rate of 15.6 and the national rate of 19.3. The percentage of infants with low birth weight is significantly greater, with Mendocino's rate at 15.1% compared to the state at 6.9%.
Indicator Gauge Icon Legend
Legend Colors
Red is bad, green is good, blue is not statistically different/neutral.
Compared to Distribution
 the value is in the best half of communities.
 the value is in the 2nd worst quarter of communities.
 the value is in the worst quarter of communities.
Compared to Target
 meets target;
  does not meet target.
Compared to a Single Value
 lower than the comparison value;
 higher than the comparison value;
 not statistically different from comparison value.
Trend

 non-significant change over time;
 significant change over time;
  no change over time.
Compared to Prior Value
 higher than the previous measurement period;
 lower than the previous measurement period;
 no statistically different change from previous measurement period.
Health / Alcohol & Drug Use
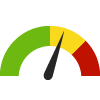
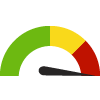
Adults who Binge Drink County: Mendocino
Adults who Binge Drink County: Mendocino
14.8%
(2021)
Compared to:
CA Counties
The distribution is based on data from 58 California counties.
U.S. Counties
The distribution is based on data from 3,074 U.S. counties and county equivalents.
US Value
(15.5%)
The regional value is compared to the national value.
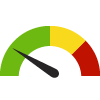
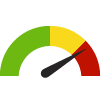
Age-Adjusted Annual Opioid Prescription Rate County: Mendocino
Age-Adjusted Annual Opioid Prescription Rate County: Mendocino
435.0
Prescriptions per 1,000 residents
(2022)
Compared to:

CA Counties
The distribution is based on data from 58 California counties.
CA Value
(291.0)
The regional value is compared to the California state value.
Prior Value
(498.9)
Prior Value compares a measured value with the previously measured value. Confidence intervals were taken into account in determining the direction of the comparison.
Trend
This comparison measures the indicator’s values over multiple time periods.<br>The Mann-Kendall Test for Statistical Significance is used to evaluate the trend<br>over 4 to 10 periods of measure, subject to data availability and comparability.
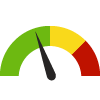
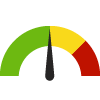
Age-Adjusted Buprenorphine Prescription Rate County: Mendocino
Age-Adjusted Buprenorphine Prescription Rate County: Mendocino
101.5
Prescriptions per 1,000 residents
(2022)
Compared to:


CA Value
(19.8)
The regional value is compared to the California state value.
Prior Value
(97.2)
Prior Value compares a measured value with the previously measured value. Confidence intervals were taken into account in determining the direction of the comparison.
Trend
This comparison measures the indicator’s values over multiple time periods.<br>The Mann-Kendall Test for Statistical Significance is used to evaluate the trend<br>over 4 to 10 periods of measure, subject to data availability and comparability.
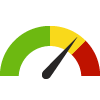
Age-Adjusted Death Rate due to All Opioid Overdose County: Mendocino
Age-Adjusted Death Rate due to All Opioid Overdose County: Mendocino
54.9
Rate per 100,000 residents
(2022)
Compared to:


CA Counties
The distribution is based on data from 58 California counties.
CA Value
(18.7)
The regional value is compared to the California state value.
Prior Value
(54.7)
Prior Value compares a measured value with the previously measured value. Confidence intervals were not taken into account in determining the direction of the comparison.
Trend
This comparison measures the indicator’s values over multiple time periods.<br>The Mann-Kendall Test for Statistical Significance is used to evaluate the trend<br>over 4 to 10 periods of measure, subject to data availability and comparability.
Age-Adjusted Death Rate due to Fentanyl Overdose County: Mendocino
Age-Adjusted Death Rate due to Fentanyl Overdose County: Mendocino
47.7
(2022)
Compared to:

CA Counties
The distribution is based on data from 58 California counties.
CA Value
(16.6)
The regional value is compared to the California state value.
Prior Value
(49.1)
Prior Value compares a measured value with the previously measured value. Confidence intervals were not taken into account in determining the direction of the comparison.
Trend
This comparison measures the indicator’s values over multiple time periods.<br>The Mann-Kendall Test for Statistical Significance is used to evaluate the trend<br>over 4 to 10 periods of measure, subject to data availability and comparability.
Age-Adjusted Death Rate due to Heroin Overdose County: Mendocino
Age-Adjusted Death Rate due to Heroin Overdose County: Mendocino
8.6
Deaths per 100,000 population
(2019)
Compared to:
CA Counties
(2018)
The distribution is based on data from 58 California counties.
CA Value
(2.4)
The regional value is compared to the California state value.
Prior Value
(3.4)
Prior Value compares a measured value with the previously measured value. Confidence intervals were not taken into account in determining the direction of the comparison.
Trend
This comparison measures the indicator’s values over multiple time periods.<br>The Mann-Kendall Test for Statistical Significance is used to evaluate the trend<br>over 4 to 10 periods of measure, subject to data availability and comparability.
HP 2030 Target
(4.2)
Health / Alcohol & Drug Use
Age-Adjusted Death Rate due to Prescription Opioid Overdose
Value
Compared to:
Age-Adjusted Death Rate due to Prescription Opioid Overdose County: Mendocino
Age-Adjusted Death Rate due to Prescription Opioid Overdose County: Mendocino
54.9
Rate per 100,000 residents
(2022)
Compared to:
CA Counties
The distribution is based on data from 58 California counties.
CA Value
(18.1)
The regional value is compared to the California state value.
Prior Value
(53.2)
Prior Value compares a measured value with the previously measured value. Confidence intervals were not taken into account in determining the direction of the comparison.
Trend
This comparison measures the indicator’s values over multiple time periods.<br>The Mann-Kendall Test for Statistical Significance is used to evaluate the trend<br>over 4 to 10 periods of measure, subject to data availability and comparability.
Health / Alcohol & Drug Use
Age-Adjusted Death Rate due to Synthetic Opioid Overdose (excluding Methadone)
Value
Compared to:
Age-Adjusted Death Rate due to Synthetic Opioid Overdose (excluding Methadone) County: Mendocino
Age-Adjusted Death Rate due to Synthetic Opioid Overdose (excluding Methadone) County: Mendocino
49.9
Rate per 100,000 residents
(2022)
Compared to:
CA Counties
The distribution is based on data from 58 California counties.
CA Value
(16.7)
The regional value is compared to the California state value.
Prior Value
(49.1)
Prior Value compares a measured value with the previously measured value. Confidence intervals were not taken into account in determining the direction of the comparison.
Trend
This comparison measures the indicator’s values over multiple time periods.<br>The Mann-Kendall Test for Statistical Significance is used to evaluate the trend<br>over 4 to 10 periods of measure, subject to data availability and comparability.
HP 2030 Target
(8.9)
<div>IVP-22: Reduce overdose deaths involving synthetic opioids other than methadone</div>
Health / Alcohol & Drug Use
Age-Adjusted Drug and Opioid-Involved Overdose Death Rate
Value
Compared to:
Age-Adjusted Drug and Opioid-Involved Overdose Death Rate County: Mendocino
Age-Adjusted Drug and Opioid-Involved Overdose Death Rate County: Mendocino
41.3
Deaths per 100,000 population
(2018-2020)
Compared to:
CA Counties
The distribution is based on data from 48 California counties.
U.S. Counties
The distribution is based on data from 1,303 U.S. counties and county equivalents.
CA Value
(16.5)
The regional value is compared to the California state value.
US Value
(23.5)
The regional value is compared to the national value.
Prior Value
(44.2)
Prior Value compares a measured value with the previously measured value. Confidence intervals were taken into account in determining the direction of the comparison.
Age-Adjusted ED Visit Rate due to All Drug Overdose County: Mendocino
Age-Adjusted ED Visit Rate due to All Drug Overdose County: Mendocino
195.9
Rate per 100,000 residents
(2022)
Compared to:
CA Counties
The distribution is based on data from 58 California counties.
CA Value
(143.7)
The regional value is compared to the California state value.
Prior Value
(246.7)
Prior Value compares a measured value with the previously measured value. Confidence intervals were not taken into account in determining the direction of the comparison.
Trend
This comparison measures the indicator’s values over multiple time periods.<br>The Mann-Kendall Test for Statistical Significance is used to evaluate the trend<br>over 4 to 10 periods of measure, subject to data availability and comparability.
Age-Adjusted ED Visit Rate due to Heroin Overdose County: Mendocino
Age-Adjusted ED Visit Rate due to Heroin Overdose County: Mendocino
4.3
Rate per 100,000 residents
(2022)
Compared to:
CA Counties
The distribution is based on data from 58 California counties.
CA Value
(3.6)
The regional value is compared to the California state value.
Prior Value
(10.2)
Prior Value compares a measured value with the previously measured value. Confidence intervals were not taken into account in determining the direction of the comparison.
Trend
This comparison measures the indicator’s values over multiple time periods.<br>The Mann-Kendall Test for Statistical Significance is used to evaluate the trend<br>over 4 to 10 periods of measure, subject to data availability and comparability.
Health / Alcohol & Drug Use
Age-Adjusted ED Visit Rate due to Opioid Overdose (excluding Heroin)
Value
Compared to:
Age-Adjusted ED Visit Rate due to Opioid Overdose (excluding Heroin) County: Mendocino
Age-Adjusted ED Visit Rate due to Opioid Overdose (excluding Heroin) County: Mendocino
88.2
Rate per 100,000 residents
(2022)
Compared to:
CA Counties
The distribution is based on data from 58 California counties.
CA Value
(54.9)
The regional value is compared to the California state value.
Prior Value
(25.3)
Prior Value compares a measured value with the previously measured value. Confidence intervals were not taken into account in determining the direction of the comparison.
Trend
This comparison measures the indicator’s values over multiple time periods.<br>The Mann-Kendall Test for Statistical Significance is used to evaluate the trend<br>over 4 to 10 periods of measure, subject to data availability and comparability.
Health / Cancer
Age-Adjusted Death Rate due to Breast Cancer County: Mendocino
Age-Adjusted Death Rate due to Breast Cancer County: Mendocino
19.1
Deaths per 100,000 females
(2019-2021)
Compared to:
CA Counties
The distribution is based on data from 56 California counties.
CA Value
(17.8)
The regional value is compared to the California state value.
US Value
(19.6 in 2016-2020)
The regional value is compared to the national value. The source for the national value is National Cancer Institute
Prior Value
(15.6)
Prior Value compares a measured value with the previously measured value. Confidence intervals were taken into account in determining the direction of the comparison.
HP 2030 Target
(15.3)
Age-Adjusted Death Rate due to Cancer County: Mendocino
Age-Adjusted Death Rate due to Cancer County: Mendocino
159.9
Deaths per 100,000 population
(2019-2021)
Compared to:
CA Counties
The distribution is based on data from 58 California counties.
CA Value
(124.9)
The regional value is compared to the California state value.
US Value
(149.4 in 2016-2020)
The regional value is compared to the national value. The source for the national value is National Cancer Institute
Prior Value
(150.8)
Prior Value compares a measured value with the previously measured value. Confidence intervals were taken into account in determining the direction of the comparison.
Trend
This comparison measures the indicator’s values over multiple time periods.<br>The Mann-Kendall Test for Statistical Significance is used to evaluate the trend<br>over 4 to 10 periods of measure, subject to data availability and comparability.
HP 2030 Target
(122.7)
Age-Adjusted Death Rate due to Lung Cancer County: Mendocino
Age-Adjusted Death Rate due to Lung Cancer County: Mendocino
30.8
Deaths per 100,000 population
(2019-2021)
Compared to:
CA Counties
The distribution is based on data from 58 California counties.
CA Value
(21.6)
The regional value is compared to the California state value.
US Value
(35.0 in 2016-2020)
The regional value is compared to the national value. The source for the national value is National Cancer Institute
Prior Value
(27.9)
Prior Value compares a measured value with the previously measured value. Confidence intervals were taken into account in determining the direction of the comparison.
Trend
This comparison measures the indicator’s values over multiple time periods.<br>The Mann-Kendall Test for Statistical Significance is used to evaluate the trend<br>over 4 to 10 periods of measure, subject to data availability and comparability.
HP 2030 Target
(25.1)
Age-Adjusted Death Rate due to Prostate Cancer County: Mendocino
Age-Adjusted Death Rate due to Prostate Cancer County: Mendocino
24.2
Deaths per 100,000 males
(2019-2021)
Compared to:
CA Counties
The distribution is based on data from 57 California counties.
CA Value
(18.4)
The regional value is compared to the California state value.
US Value
(18.8 in 2016-2020)
The regional value is compared to the national value. The source for the national value is National Cancer Institute
Prior Value
(25.0)
Prior Value compares a measured value with the previously measured value. Confidence intervals were taken into account in determining the direction of the comparison.
HP 2030 Target
(16.9)
Health / Diabetes
Age-Adjusted Death Rate due to Diabetes County: Mendocino
Age-Adjusted Death Rate due to Diabetes County: Mendocino
20.1
Deaths per 100,000 population
(2019-2021)
Compared to:
CA Counties
The distribution is based on data from 57 California counties.
CA Value
(23.1)
The regional value is compared to the California state value.
US Value
(24.8 in 2020)
The regional value is compared to the national value. The source for the national value is Centers for Disease Control and Prevention
Prior Value
(19.4)
Prior Value compares a measured value with the previously measured value. Confidence intervals were taken into account in determining the direction of the comparison.
Trend
This comparison measures the indicator’s values over multiple time periods.<br>The Mann-Kendall Test for Statistical Significance is used to evaluate the trend<br>over 4 to 10 periods of measure, subject to data availability and comparability.
Health / Heart Disease & Stroke
Health / Heart Disease & Stroke
Age-Adjusted Death Rate due to Cerebrovascular Disease (Stroke)
Value
Compared to:
Age-Adjusted Death Rate due to Cerebrovascular Disease (Stroke) County: Mendocino
Age-Adjusted Death Rate due to Cerebrovascular Disease (Stroke) County: Mendocino
35.3
Deaths per 100,000 population
(2019-2021)
Compared to:
CA Counties
The distribution is based on data from 58 California counties.
CA Value
(37.2)
The regional value is compared to the California state value.
US Value
(38.8 in 2020)
The regional value is compared to the national value. The source for the national value is Centers for Disease Control and Prevention
Prior Value
(37.1)
Prior Value compares a measured value with the previously measured value. Confidence intervals were taken into account in determining the direction of the comparison.
Trend
This comparison measures the indicator’s values over multiple time periods.<br>The Mann-Kendall Test for Statistical Significance is used to evaluate the trend<br>over 4 to 10 periods of measure, subject to data availability and comparability.
HP 2030 Target
(33.4)
Health / Heart Disease & Stroke
Age-Adjusted Death Rate due to Coronary Heart Disease
Value
Compared to:
Age-Adjusted Death Rate due to Coronary Heart Disease County: Mendocino
Age-Adjusted Death Rate due to Coronary Heart Disease County: Mendocino
97.8
Deaths per 100,000 population
(2019-2021)
Compared to:
CA Counties
The distribution is based on data from 58 California counties.
CA Value
(79.0)
The regional value is compared to the California state value.
US Value
(91.8 in 2020)
The regional value is compared to the national value. The source for the national value is Centers for Disease Control and Prevention
Prior Value
(90.4)
Prior Value compares a measured value with the previously measured value. Confidence intervals were taken into account in determining the direction of the comparison.
Trend
This comparison measures the indicator’s values over multiple time periods.<br>The Mann-Kendall Test for Statistical Significance is used to evaluate the trend<br>over 4 to 10 periods of measure, subject to data availability and comparability.
HP 2030 Target
(71.1)
Age-Adjusted Death Rate due to Heart Attack County: Mendocino
Age-Adjusted Death Rate due to Heart Attack County: Mendocino
62.9
Deaths per 100,000 population 35+ years
(2021)
Compared to:
CA Counties
The distribution is based on data from 58 California counties.
U.S. Counties
The distribution is based on data from 3,101 U.S. counties and county equivalents.
CA Value
(44.3)
The regional value is compared to the California state value.
Prior Value
(64.7)
Prior Value compares a measured value with the previously measured value. Confidence intervals were not taken into account in determining the direction of the comparison.
Trend
This comparison measures the indicator’s values over multiple time periods.<br>The Mann-Kendall Test for Statistical Significance is used to evaluate the trend<br>over 4 to 10 periods of measure, subject to data availability and comparability.
Health / Immunizations & Infectious Diseases
Health / Immunizations & Infectious Diseases
Age-Adjusted Death Rate due to Influenza and Pneumonia
Value
Compared to:
Age-Adjusted Death Rate due to Influenza and Pneumonia County: Mendocino
Age-Adjusted Death Rate due to Influenza and Pneumonia County: Mendocino
12.1
Deaths per 100,000 population
(2019-2021)
Compared to:
CA Counties
The distribution is based on data from 57 California counties.
CA Value
(11.5)
The regional value is compared to the California state value.
US Value
(13.0 in 2020)
The regional value is compared to the national value. The source for the national value is Centers for Disease Control and Prevention
Prior Value
(14.2)
Prior Value compares a measured value with the previously measured value. Confidence intervals were taken into account in determining the direction of the comparison.
Health / Mental Health & Mental Disorders
Adults Ever Diagnosed with Depression County: Mendocino
Adults Ever Diagnosed with Depression County: Mendocino
19.2%
(2021)
Compared to:
CA Counties
The distribution is based on data from 58 California counties.
U.S. Counties
The distribution is based on data from 3,074 U.S. counties and county equivalents.
US Value
(19.5%)
The regional value is compared to the national value.
Health / Mental Health & Mental Disorders
Adults Needing and Receiving Behavioral Health Care Services
Value
Compared to:
Adults Needing and Receiving Behavioral Health Care Services County: Mendocino
Adults Needing and Receiving Behavioral Health Care Services County: Mendocino
59.4%
(2021-2022)
Compared to:
CA Counties
The distribution is based on data from 58 California counties.
CA Value
(55.9%)
The regional value is compared to the California state value.
Prior Value
(62.2%)
Prior Value compares a measured value with the previously measured value. Confidence intervals were taken into account in determining the direction of the comparison.
Trend
This comparison measures the indicator’s values over multiple time periods.<br>The Mann-Kendall Test for Statistical Significance is used to evaluate the trend<br>over 4 to 10 periods of measure, subject to data availability and comparability.
Health / Mental Health & Mental Disorders
Adults with Likely Serious Psychological Distress
Value
Compared to:
Adults with Likely Serious Psychological Distress County: Mendocino
Adults with Likely Serious Psychological Distress County: Mendocino
12.9%
(2021-2022)
Compared to:
CA Counties
The distribution is based on data from 58 California counties.
CA Value
(16.7%)
The regional value is compared to the California state value.
Prior Value
(12.7%)
Prior Value compares a measured value with the previously measured value. Confidence intervals were taken into account in determining the direction of the comparison.
Trend
This comparison measures the indicator’s values over multiple time periods.<br>The Mann-Kendall Test for Statistical Significance is used to evaluate the trend<br>over 4 to 10 periods of measure, subject to data availability and comparability.
Age-Adjusted Death Rate due to Suicide County: Mendocino
Age-Adjusted Death Rate due to Suicide County: Mendocino
24.2
Deaths per 100,000 population
(2019-2021)
Compared to:
CA Counties
The distribution is based on data from 57 California counties.
CA Value
(10.3)
The regional value is compared to the California state value.
US Value
(13.5 in 2020)
The regional value is compared to the national value. The source for the national value is Centers for Disease Control and Prevention
Prior Value
(20.8)
Prior Value compares a measured value with the previously measured value. Confidence intervals were taken into account in determining the direction of the comparison.
Trend
This comparison measures the indicator’s values over multiple time periods.<br>The Mann-Kendall Test for Statistical Significance is used to evaluate the trend<br>over 4 to 10 periods of measure, subject to data availability and comparability.
HP 2030 Target
(12.8)
<div>MHMD-01: Reduce the suicide rate <strong>(LEADING HEALTH INDICATOR)</strong></div>
Health / Older Adults
Health / Older Adults
Adults 65+ who Received Recommended Preventive Services: Females
Value
Compared to:
Adults 65+ who Received Recommended Preventive Services: Females County: Mendocino
Adults 65+ who Received Recommended Preventive Services: Females County: Mendocino
29.2%
(2020)
Compared to:

CA Counties
The distribution is based on data from 58 California counties.
U.S. Counties
The distribution is based on data from 3,141 U.S. counties and county equivalents.
US Value
(37.9%)
The regional value is compared to the national value.
Health / Older Adults
Adults 65+ who Received Recommended Preventive Services: Males
Value
Compared to:
Adults 65+ who Received Recommended Preventive Services: Males County: Mendocino
Adults 65+ who Received Recommended Preventive Services: Males County: Mendocino
38.3%
(2020)
Compared to:
CA Counties
The distribution is based on data from 58 California counties.
U.S. Counties
The distribution is based on data from 3,141 U.S. counties and county equivalents.
US Value
(43.7%)
The regional value is compared to the national value.
Adults 65+ with a Disability County: Mendocino
Adults 65+ with a Disability County: Mendocino
36.4%
(2018-2022)
Compared to:

CA Value
(33.5%)
The regional value is compared to the California state value.
US Value
(33.3%)
The regional value is compared to the national value.
Trend
This comparison measures the indicator’s values over multiple time periods.<br>The Mann-Kendall Test for Statistical Significance is used to evaluate the trend<br>over 4 to 10 periods of measure, subject to data availability and comparability.
Adults 65+ with a Hearing Difficulty County: Mendocino
Adults 65+ with a Hearing Difficulty County: Mendocino
15.4%
(2018-2022)
Compared to:
CA Value
(12.9%)
The regional value is compared to the California state value.
US Value
(13.7%)
The regional value is compared to the national value.
Trend
This comparison measures the indicator’s values over multiple time periods.<br>The Mann-Kendall Test for Statistical Significance is used to evaluate the trend<br>over 4 to 10 periods of measure, subject to data availability and comparability.
Adults 65+ with a Self-Care Difficulty County: Mendocino
Adults 65+ with a Self-Care Difficulty County: Mendocino
9.3%
(2018-2022)
Compared to:


CA Value
(9.5%)
The regional value is compared to the California state value.
US Value
(7.4%)
The regional value is compared to the national value.
Trend
This comparison measures the indicator’s values over multiple time periods.<br>The Mann-Kendall Test for Statistical Significance is used to evaluate the trend<br>over 4 to 10 periods of measure, subject to data availability and comparability.
Adults 65+ with a Vision Difficulty County: Mendocino
Adults 65+ with a Vision Difficulty County: Mendocino
7.9%
(2018-2022)
Compared to:
CA Value
(6.1%)
The regional value is compared to the California state value.
US Value
(6.0%)
The regional value is compared to the national value.
Trend
This comparison measures the indicator’s values over multiple time periods.<br>The Mann-Kendall Test for Statistical Significance is used to evaluate the trend<br>over 4 to 10 periods of measure, subject to data availability and comparability.
Adults 65+ with an Independent Living Difficulty County: Mendocino
Adults 65+ with an Independent Living Difficulty County: Mendocino
16.0%
(2018-2022)
Compared to:
CA Value
(16.4%)
The regional value is compared to the California state value.
US Value
(13.6%)
The regional value is compared to the national value.
Trend
This comparison measures the indicator’s values over multiple time periods.<br>The Mann-Kendall Test for Statistical Significance is used to evaluate the trend<br>over 4 to 10 periods of measure, subject to data availability and comparability.
Health / Oral Health
Adults 65+ with Total Tooth Loss County: Mendocino
Adults 65+ with Total Tooth Loss County: Mendocino
11.2%
(2020)
Compared to:
CA Counties
The distribution is based on data from 58 California counties.
U.S. Counties
The distribution is based on data from 3,141 U.S. counties and county equivalents.
US Value
(13.4%)
The regional value is compared to the national value.
Health / Other Conditions
Adults with Arthritis County: Mendocino
Adults with Arthritis County: Mendocino
29.1%
(2021)
Compared to:
CA Counties
The distribution is based on data from 58 California counties.
U.S. Counties
The distribution is based on data from 3,074 U.S. counties and county equivalents.
US Value
(25.2%)
The regional value is compared to the national value.
Adults with Kidney Disease County: Mendocino
Adults with Kidney Disease County: Mendocino
3.8%
(2021)
Compared to:
CA Counties
The distribution is based on data from 58 California counties.
U.S. Counties
The distribution is based on data from 3,074 U.S. counties and county equivalents.
US Value
(3.1%)
The regional value is compared to the national value.
Health / Prevention & Safety
Age-Adjusted Death Rate due to Firearms County: Mendocino
Age-Adjusted Death Rate due to Firearms County: Mendocino
12.3
Deaths per 100,000 population
(2018-2020)
Compared to:
CA Counties
The distribution is based on data from 45 California counties.
U.S. Counties
The distribution is based on data from 1,083 U.S. counties and county equivalents.
CA Value
(7.4)
The regional value is compared to the California state value.
US Value
(12.0)
The regional value is compared to the national value.
Prior Value
(14.7)
Prior Value compares a measured value with the previously measured value. Confidence intervals were taken into account in determining the direction of the comparison.
Trend
This comparison measures the indicator’s values over multiple time periods.<br>The Mann-Kendall Test for Statistical Significance is used to evaluate the trend<br>over 4 to 10 periods of measure, subject to data availability and comparability.
HP 2030 Target
(10.7)
Health / Prevention & Safety
Age-Adjusted Death Rate due to Unintentional Injuries
Value
Compared to:
Age-Adjusted Death Rate due to Unintentional Injuries County: Mendocino
Age-Adjusted Death Rate due to Unintentional Injuries County: Mendocino
106.5
Deaths per 100,000 population
(2019-2021)
Compared to:
CA Counties
The distribution is based on data from 58 California counties.
CA Value
(43.4)
The regional value is compared to the California state value.
US Value
(57.6 in 2020)
The regional value is compared to the national value. The source for the national value is Centers for Disease Control and Prevention
Prior Value
(89.6)
Prior Value compares a measured value with the previously measured value. Confidence intervals were taken into account in determining the direction of the comparison.
Trend
This comparison measures the indicator’s values over multiple time periods.<br>The Mann-Kendall Test for Statistical Significance is used to evaluate the trend<br>over 4 to 10 periods of measure, subject to data availability and comparability.
HP 2030 Target
(43.2)
Health / Tobacco Use
11th Grade Students Who Report Vaping or Using E-Cigarettes County: Mendocino
11th Grade Students Who Report Vaping or Using E-Cigarettes County: Mendocino
43.4%
(2017-2019)
Compared to:
CA Value
(26.2%)
The regional value is compared to the California state value.
Prior Value
(11.5%)
Prior Value compares a measured value with the previously measured value. Confidence intervals were not taken into account in determining the direction of the comparison.
7th Grade Students Who Report Vaping or Using E-Cigarettes County: Mendocino
7th Grade Students Who Report Vaping or Using E-Cigarettes County: Mendocino
9.2%
(2017-2019)
Compared to:
CA Value
(4.0%)
The regional value is compared to the California state value.
Prior Value
(6.1%)
Prior Value compares a measured value with the previously measured value. Confidence intervals were not taken into account in determining the direction of the comparison.
9th Grade Students Who Report Vaping or Using E-Cigarettes County: Mendocino
9th Grade Students Who Report Vaping or Using E-Cigarettes County: Mendocino
21.7%
(2017-2019)
Compared to:
CA Value
(8.7%)
The regional value is compared to the California state value.
Prior Value
(13.4%)
Prior Value compares a measured value with the previously measured value. Confidence intervals were not taken into account in determining the direction of the comparison.
Adults who Smoke County: Mendocino
Adults who Smoke County: Mendocino
7.5%
(2021-2022)
Compared to:
CA Counties
The distribution is based on data from 58 California counties.
CA Value
(6.1%)
The regional value is compared to the California state value.
US Value
(14.0% in 2022)
The regional value is compared to the national value. The source for the national value is Behavioral Risk Factor Surveillance System
Prior Value
(7.5%)
Prior Value compares a measured value with the previously measured value. Confidence intervals were taken into account in determining the direction of the comparison.
Trend
This comparison measures the indicator’s values over multiple time periods.<br>The Mann-Kendall Test for Statistical Significance is used to evaluate the trend<br>over 4 to 10 periods of measure, subject to data availability and comparability.
HP 2030 Target
(6.1%)
<div>TU-02: Reduce current cigarette smoking in adults <strong>(LEADING HEALTH INDICATOR)</strong></div>
Adults Who Used Electronic Cigarettes: Past 30 Days County: Mendocino
Adults Who Used Electronic Cigarettes: Past 30 Days County: Mendocino
4.5%
(2019-2020)
Compared to:
CA Value
(3.3%)
The regional value is compared to the California state value.
Prior Value
(6.5%)
Prior Value compares a measured value with the previously measured value. Confidence intervals were taken into account in determining the direction of the comparison.
Health / Weight Status
Adults Who Are Obese County: Mendocino
Adults Who Are Obese County: Mendocino
29.7%
(2022)
Compared to:
CA Counties
The distribution is based on data from 58 California counties.
CA Value
(28.8%)
The regional value is compared to the California state value.
US Value
(33.6%)
The regional value is compared to the national value. The source for the national value is Behavioral Risk Factor Surveillance System
Prior Value
(21.6%)
Prior Value compares a measured value with the previously measured value. Confidence intervals were taken into account in determining the direction of the comparison.
Trend
This comparison measures the indicator’s values over multiple time periods.<br>The Mann-Kendall Test for Statistical Significance is used to evaluate the trend<br>over 4 to 10 periods of measure, subject to data availability and comparability.
Adults who are Overweight or Obese County: Mendocino
Adults who are Overweight or Obese County: Mendocino
64.2%
(2022)
Compared to:
CA Counties
The distribution is based on data from 58 California counties.
CA Value
(62.3%)
The regional value is compared to the California state value.
US Value
(67.7%)
The regional value is compared to the national value. The source for the national value is Behavioral Risk Factor Surveillance System
Prior Value
(57.3%)
Prior Value compares a measured value with the previously measured value. Confidence intervals were taken into account in determining the direction of the comparison.
Trend
This comparison measures the indicator’s values over multiple time periods.<br>The Mann-Kendall Test for Statistical Significance is used to evaluate the trend<br>over 4 to 10 periods of measure, subject to data availability and comparability.
Community / Crime & Crime Prevention
Age-Adjusted Death Rate due to Homicide County: Mendocino
Age-Adjusted Death Rate due to Homicide County: Mendocino
8.7
Deaths per 100,000 population
(2018-2020)
Compared to:
CA Counties
The distribution is based on data from 32 California counties.
U.S. Counties
The distribution is based on data from 495 U.S. counties and county equivalents.
CA Value
(5.1)
The regional value is compared to the California state value.
US Value
(6.6)
The regional value is compared to the national value.
HP 2030 Target
(5.5)
<div>IVP-09: Reduce homicides <strong>(LEADING HEALTH INDICATOR)</strong></div>
Community / Public Safety
Community / Public Safety
Age-Adjusted Death Rate due to Motor Vehicle Traffic Collisions
Value
Compared to:
Age-Adjusted Death Rate due to Motor Vehicle Traffic Collisions County: Mendocino
Age-Adjusted Death Rate due to Motor Vehicle Traffic Collisions County: Mendocino
28.6
Deaths per 100,000 population
(2019-2021)
Compared to:
CA Counties
The distribution is based on data from 57 California counties.
CA Value
(10.7)
The regional value is compared to the California state value.
US Value
(12.0 in 2020)
The regional value is compared to the national value. The source for the national value is Centers for Disease Control and Prevention
Prior Value
(29.3)
Prior Value compares a measured value with the previously measured value. Confidence intervals were taken into account in determining the direction of the comparison.
HP 2030 Target
(10.1)
