
Search for Indicators
Mendocino County Indicators
The indicator system provides easy access to information on health and well-being in Mendocino County in eight topic areas. Core indicator data are collected and reported by state and federal sources. The Healthy Communities Institute, which manages the site, updates indicators soon after they are updated by their respective data sources. The frequency and timing of the updates varies with the source.
The data sources meet the following criteria:
- Validated methodology for data collection and analysis
- Regular, scheduled publication of findings
- Focus on data values for small geographic areas, such as counties and postal codes that are available for all county-level locations in the U.S or locally through our community partners
The value for each indicator is shown along with comparisons that provide context for the information. The comparisons show how each value compares to those in other geographic areas, how Mendocino County is changing over time, and how we compare to a national or state average.
Indicator Gauge Icon Legend
Legend Colors
Red is bad, green is good, blue is not statistically different/neutral.
Compared to Distribution
 the value is in the best half of communities.
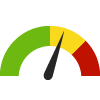 the value is in the 2nd worst quarter of communities.
 the value is in the worst quarter of communities.
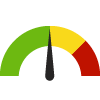
Compared to Target
 meets target;
  does not meet target.
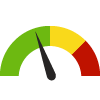
Compared to a Single Value
 lower than the comparison value;
 higher than the comparison value;
 not statistically different from comparison value.
Trend

 non-significant change over time;
 significant change over time;
  no change over time.
Compared to Prior Value
 higher than the previous measurement period;
 lower than the previous measurement period;
 no statistically different change from previous measurement period.
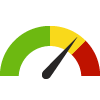
County: Mendocino
Health / Sexually Transmitted Infections
Value
Compared to:
County: Mendocino Persons Living with HIV Rate
County: Mendocino Persons Living with HIV Rate
199.2
Cases per 100,000 population
(2022)
Compared to:


CA Value
(355.6)
The regional value is compared to the California state value.
Prior Value
(138.5)
Prior Value compares a measured value with the previously measured value. Confidence intervals were not taken into account in determining the direction of the comparison.
Trend
This comparison measures the indicator’s values over multiple time periods.<br>The Mann-Kendall Test for Statistical Significance is used to evaluate the trend<br>over 4 to 10 periods of measure, subject to data availability and comparability.
County: Mendocino Syphilis Incidence Rate
County: Mendocino Syphilis Incidence Rate
17.6
Cases per 100,000 population
(2021)
Compared to:


CA Counties
The distribution is based on data from 58 California counties.
CA Value
(22.3)
The regional value is compared to the California state value.
US Value
(16.2)
The regional value is compared to the national value. The source for the national value is National Center for HIV/AIDS, Viral Hepatitis, STD, and TB Prevention
Prior Value
(8.0)
Prior Value compares a measured value with the previously measured value. Confidence intervals were not taken into account in determining the direction of the comparison.
Trend
This comparison measures the indicator’s values over multiple time periods.<br>The Mann-Kendall Test for Statistical Significance is used to evaluate the trend<br>over 4 to 10 periods of measure, subject to data availability and comparability.
County: Mendocino
Health / Tobacco Use
Value
Compared to:
County: Mendocino 11th Grade Students Who Report Vaping or Using E-Cigarettes
County: Mendocino 11th Grade Students Who Report Vaping or Using E-Cigarettes
43.4%
(2017-2019)
Compared to:
CA Value
(26.2%)
The regional value is compared to the California state value.
Prior Value
(11.5%)
Prior Value compares a measured value with the previously measured value. Confidence intervals were not taken into account in determining the direction of the comparison.
County: Mendocino 7th Grade Students Who Report Vaping or Using E-Cigarettes
County: Mendocino 7th Grade Students Who Report Vaping or Using E-Cigarettes
9.2%
(2017-2019)
Compared to:
CA Value
(4.0%)
The regional value is compared to the California state value.
Prior Value
(6.1%)
Prior Value compares a measured value with the previously measured value. Confidence intervals were not taken into account in determining the direction of the comparison.
County: Mendocino 9th Grade Students Who Report Vaping or Using E-Cigarettes
County: Mendocino 9th Grade Students Who Report Vaping or Using E-Cigarettes
21.7%
(2017-2019)
Compared to:
CA Value
(8.7%)
The regional value is compared to the California state value.
Prior Value
(13.4%)
Prior Value compares a measured value with the previously measured value. Confidence intervals were not taken into account in determining the direction of the comparison.
County: Mendocino Adults who Smoke
County: Mendocino Adults who Smoke
7.5%
(2021-2022)
Compared to:
CA Counties
The distribution is based on data from 58 California counties.
CA Value
(6.1%)
The regional value is compared to the California state value.
US Value
(14.0% in 2022)
The regional value is compared to the national value. The source for the national value is Behavioral Risk Factor Surveillance System
Prior Value
(7.5%)
Prior Value compares a measured value with the previously measured value. Confidence intervals were taken into account in determining the direction of the comparison.
Trend
This comparison measures the indicator’s values over multiple time periods.<br>The Mann-Kendall Test for Statistical Significance is used to evaluate the trend<br>over 4 to 10 periods of measure, subject to data availability and comparability.
HP 2030 Target
(6.1%)
<div>TU-02: Reduce current cigarette smoking in adults <strong>(LEADING HEALTH INDICATOR)</strong></div>
County: Mendocino Adults Who Used Electronic Cigarettes: Past 30 Days
County: Mendocino Adults Who Used Electronic Cigarettes: Past 30 Days
4.5%
(2019-2020)
Compared to:
CA Value
(3.3%)
The regional value is compared to the California state value.
Prior Value
(6.5%)
Prior Value compares a measured value with the previously measured value. Confidence intervals were taken into account in determining the direction of the comparison.
County: Mendocino Teens who Smoke: 11th Graders
County: Mendocino Teens who Smoke: 11th Graders
7.0%
(2017-2019)
Compared to:
CA Value
(2.0%)
The regional value is compared to the California state value.
Prior Value
(3.0%)
Prior Value compares a measured value with the previously measured value. Confidence intervals were not taken into account in determining the direction of the comparison.
Trend
This comparison measures the indicator’s values over multiple time periods.<br>The Mann-Kendall Test for Statistical Significance is used to evaluate the trend<br>over 4 to 10 periods of measure, subject to data availability and comparability.
County: Mendocino
Health / Weight Status
Value
Compared to:
County: Mendocino Adults Who Are Obese
County: Mendocino Adults Who Are Obese
29.7%
(2022)
Compared to:
CA Counties
The distribution is based on data from 58 California counties.
CA Value
(28.8%)
The regional value is compared to the California state value.
US Value
(33.6%)
The regional value is compared to the national value. The source for the national value is Behavioral Risk Factor Surveillance System
Prior Value
(21.6%)
Prior Value compares a measured value with the previously measured value. Confidence intervals were taken into account in determining the direction of the comparison.
Trend
This comparison measures the indicator’s values over multiple time periods.<br>The Mann-Kendall Test for Statistical Significance is used to evaluate the trend<br>over 4 to 10 periods of measure, subject to data availability and comparability.
County: Mendocino Adults who are Overweight or Obese
County: Mendocino Adults who are Overweight or Obese
64.2%
(2022)
Compared to:
CA Counties
The distribution is based on data from 58 California counties.
CA Value
(62.3%)
The regional value is compared to the California state value.
US Value
(67.7%)
The regional value is compared to the national value. The source for the national value is Behavioral Risk Factor Surveillance System
Prior Value
(57.3%)
Prior Value compares a measured value with the previously measured value. Confidence intervals were taken into account in determining the direction of the comparison.
Trend
This comparison measures the indicator’s values over multiple time periods.<br>The Mann-Kendall Test for Statistical Significance is used to evaluate the trend<br>over 4 to 10 periods of measure, subject to data availability and comparability.
County: Mendocino Children who are Overweight for Age
County: Mendocino Children who are Overweight for Age
18.5%
(2019-2020)
Compared to:
CA Value
(13.9%)
The regional value is compared to the California state value.
Prior Value
(20.8%)
Prior Value compares a measured value with the previously measured value. Confidence intervals were taken into account in determining the direction of the comparison.
County: Mendocino
Health / Wellness & Lifestyle
Value
Compared to:
County: Mendocino Adult Self-Reported General Health Assessment: Good or Better
County: Mendocino Adult Self-Reported General Health Assessment: Good or Better
82.5%
(2021-2022)
Compared to:


CA Counties
The distribution is based on data from 58 California counties.
CA Value
(85.0%)
The regional value is compared to the California state value.
Prior Value
(82.3%)
Prior Value compares a measured value with the previously measured value. Confidence intervals were taken into account in determining the direction of the comparison.
Trend
This comparison measures the indicator’s values over multiple time periods.<br>The Mann-Kendall Test for Statistical Significance is used to evaluate the trend<br>over 4 to 10 periods of measure, subject to data availability and comparability.
County: Mendocino Frequent Physical Distress
County: Mendocino Frequent Physical Distress
13.5%
(2019)
Compared to:
CA Counties
The distribution is based on data from 58 California counties.
U.S. Counties
The distribution is based on data from 3,121 U.S. counties and county equivalents.
CA Value
(11.3%)
The regional value is compared to the California state value.
US Value
(12.0%)
The regional value is compared to the national value.
Prior Value
(14.7%)
Prior Value compares a measured value with the previously measured value. Confidence intervals were taken into account in determining the direction of the comparison.
County: Mendocino Insufficient Sleep
County: Mendocino Insufficient Sleep
31.0%
(2020)
Compared to:
CA Counties
The distribution is based on data from 58 California counties.
U.S. Counties
The distribution is based on data from 3,141 U.S. counties and county equivalents.
US Value
(32.7%)
The regional value is compared to the national value.
HP 2030 Target
(26.7%)
County: Mendocino Poor Physical Health: 14+ Days
County: Mendocino Poor Physical Health: 14+ Days
13.7%
(2021)
Compared to:

CA Counties
The distribution is based on data from 58 California counties.
U.S. Counties
The distribution is based on data from 3,074 U.S. counties and county equivalents.
US Value
(10.9%)
The regional value is compared to the national value.
County: Mendocino Poor Physical Health: Average Number of Days
County: Mendocino Poor Physical Health: Average Number of Days
4.0
Days
(2021)
Compared to:
CA Counties
The distribution is based on data from 58 California counties.
U.S. Counties
The distribution is based on data from 3,141 U.S. counties and county equivalents.
CA Value
(3.1)
The regional value is compared to the California state value.
US Value
(3.3)
The regional value is compared to the national value.
Prior Value
(3.6)
Prior Value compares a measured value with the previously measured value. Confidence intervals were taken into account in determining the direction of the comparison.
Trend
This comparison measures the indicator’s values over multiple time periods.<br>The Mann-Kendall Test for Statistical Significance is used to evaluate the trend<br>over 4 to 10 periods of measure, subject to data availability and comparability.
County: Mendocino Self-Reported General Health Assessment: Good or Better
County: Mendocino Self-Reported General Health Assessment: Good or Better
80.3%
(2022)
Compared to:

CA Counties
The distribution is based on data from 58 California counties.
CA Value
(86.0%)
The regional value is compared to the California state value.
Prior Value
(87.9%)
Prior Value compares a measured value with the previously measured value. Confidence intervals were taken into account in determining the direction of the comparison.
Trend
This comparison measures the indicator’s values over multiple time periods.<br>The Mann-Kendall Test for Statistical Significance is used to evaluate the trend<br>over 4 to 10 periods of measure, subject to data availability and comparability.
County: Mendocino Self-Reported General Health Assessment: Poor or Fair
County: Mendocino Self-Reported General Health Assessment: Poor or Fair
19.7%
(2021)
Compared to:
CA Counties
The distribution is based on data from 58 California counties.
U.S. Counties
The distribution is based on data from 3,074 U.S. counties and county equivalents.
US Value
(16.1%)
The regional value is compared to the national value.
County: Mendocino
Community / Civic Engagement
Value
Compared to:
County: Mendocino Voter Engagement
County: Mendocino Voter Engagement
82.3%
Percent of adults
(2022)
Compared to:
CA Counties
The distribution is based on data from 58 California counties.
CA Value
(66.2%)
The regional value is compared to the California state value.
Prior Value
(69.8%)
Prior Value compares a measured value with the previously measured value. Confidence intervals were taken into account in determining the direction of the comparison.
Trend
This comparison measures the indicator’s values over multiple time periods.<br>The Mann-Kendall Test for Statistical Significance is used to evaluate the trend<br>over 4 to 10 periods of measure, subject to data availability and comparability.
County: Mendocino Voter Turnout: Presidential Election
County: Mendocino Voter Turnout: Presidential Election
82.2%
(2020)
Compared to:
CA Counties
The distribution is based on data from 58 California counties.
CA Value
(80.7%)
The regional value is compared to the California state value.
Prior Value
(75.9%)
Prior Value compares a measured value with the previously measured value. Confidence intervals were not taken into account in determining the direction of the comparison.
Trend
This comparison measures the indicator’s values over multiple time periods.<br>The Mann-Kendall Test for Statistical Significance is used to evaluate the trend<br>over 4 to 10 periods of measure, subject to data availability and comparability.
HP 2030 Target
(58.4%)
<div>SDOH-07: Increase the proportion of the voting-age citizens who vote</div>
County: Mendocino
Community / Crime & Crime Prevention
Value
Compared to:
County: Mendocino Adult Arrest Rate
County: Mendocino Adult Arrest Rate
26.8
Arrests per 1,000 population 18+
(2022)
Compared to:
CA Counties
The distribution is based on data from 58 California counties.
CA Value
(25.1)
The regional value is compared to the California state value.
Prior Value
(43.8)
Prior Value compares a measured value with the previously measured value. Confidence intervals were not taken into account in determining the direction of the comparison.
Trend
This comparison measures the indicator’s values over multiple time periods.<br>The Mann-Kendall Test for Statistical Significance is used to evaluate the trend<br>over 4 to 10 periods of measure, subject to data availability and comparability.
County: Mendocino Age-Adjusted Death Rate due to Homicide
County: Mendocino Age-Adjusted Death Rate due to Homicide
8.7
Deaths per 100,000 population
(2018-2020)
Compared to:
CA Counties
The distribution is based on data from 32 California counties.
U.S. Counties
The distribution is based on data from 495 U.S. counties and county equivalents.
CA Value
(5.1)
The regional value is compared to the California state value.
US Value
(6.6)
The regional value is compared to the national value.
HP 2030 Target
(5.5)
<div>IVP-09: Reduce homicides <strong>(LEADING HEALTH INDICATOR)</strong></div>
County: Mendocino Homicide Rate
County: Mendocino Homicide Rate
2.2
Homicides per 100,000 population
(2022)
Compared to:
CA Counties
The distribution is based on data from 58 California counties.
CA Value
(5.6)
The regional value is compared to the California state value.
Prior Value
(8.8)
Prior Value compares a measured value with the previously measured value. Confidence intervals were not taken into account in determining the direction of the comparison.
Trend
This comparison measures the indicator’s values over multiple time periods.<br>The Mann-Kendall Test for Statistical Significance is used to evaluate the trend<br>over 4 to 10 periods of measure, subject to data availability and comparability.
County: Mendocino Homicides
County: Mendocino Homicides
2
(2022)
Compared to:
Prior Value
(8)
Prior Value compares a measured value with the previously measured value. Confidence intervals were not taken into account in determining the direction of the comparison.
Trend
This comparison measures the indicator’s values over multiple time periods.<br>The Mann-Kendall Test for Statistical Significance is used to evaluate the trend<br>over 4 to 10 periods of measure, subject to data availability and comparability.
County: Mendocino Juvenile Arrest Rate
County: Mendocino Juvenile Arrest Rate
5.3
Arrests per 1,000 population aged 0-17
(2022)
Compared to:
CA Counties
The distribution is based on data from 57 California counties.
CA Value
(2.8)
The regional value is compared to the California state value.
Prior Value
(2.6)
Prior Value compares a measured value with the previously measured value. Confidence intervals were not taken into account in determining the direction of the comparison.
Trend
This comparison measures the indicator’s values over multiple time periods.<br>The Mann-Kendall Test for Statistical Significance is used to evaluate the trend<br>over 4 to 10 periods of measure, subject to data availability and comparability.
County: Mendocino Violent Crime Rate
County: Mendocino Violent Crime Rate
202.3
Crimes per 100,000 population
(2022)
Compared to:
CA Counties
The distribution is based on data from 58 California counties.
CA Value
(493.1)
The regional value is compared to the California state value.
US Value
(380.7)
The regional value is compared to the national value. The source for the national value is Federal Bureau of Investigation
Prior Value
(520.9)
Prior Value compares a measured value with the previously measured value. Confidence intervals were not taken into account in determining the direction of the comparison.
Trend
This comparison measures the indicator’s values over multiple time periods.<br>The Mann-Kendall Test for Statistical Significance is used to evaluate the trend<br>over 4 to 10 periods of measure, subject to data availability and comparability.
County: Mendocino Violent Crime Rate: Rape
County: Mendocino Violent Crime Rate: Rape
21.1
Per 100,000 population
(2022)
Compared to:
CA Counties
The distribution is based on data from 58 California counties.
CA Value
(36.6)
The regional value is compared to the California state value.
Prior Value
(58.4)
Prior Value compares a measured value with the previously measured value. Confidence intervals were not taken into account in determining the direction of the comparison.
Trend
This comparison measures the indicator’s values over multiple time periods.<br>The Mann-Kendall Test for Statistical Significance is used to evaluate the trend<br>over 4 to 10 periods of measure, subject to data availability and comparability.
County: Mendocino
Community / Demographics
Value
Compared to:
County: Mendocino Average Household Size
County: Mendocino Average Household Size
2.60
Persons per household
(2018-2022)
Compared to:

CA Value
(2.90)
The regional value is compared to the California state value.
US Value
(2.60)
The regional value is compared to the national value.
Trend
This comparison measures the indicator’s values over multiple time periods.<br>The Mann-Kendall Test for Statistical Significance is used to evaluate the trend<br>over 4 to 10 periods of measure, subject to data availability and comparability.
County: Mendocino Foreign Born Persons
County: Mendocino Foreign Born Persons
11.3%
(2018-2022)
Compared to:
CA Value
(26.5%)
The regional value is compared to the California state value.
US Value
(13.7%)
The regional value is compared to the national value.
Trend
This comparison measures the indicator’s values over multiple time periods.<br>The Mann-Kendall Test for Statistical Significance is used to evaluate the trend<br>over 4 to 10 periods of measure, subject to data availability and comparability.
County: Mendocino Population Over Age 65 (Count)
County: Mendocino Population Over Age 65 (Count)
21,197
People
(2018-2022)
Compared to:

Trend
This comparison measures the indicator’s values over multiple time periods.<br>The Mann-Kendall Test for Statistical Significance is used to evaluate the trend<br>over 4 to 10 periods of measure, subject to data availability and comparability.
County: Mendocino Veteran Population
County: Mendocino Veteran Population
6.6%
(2018-2022)
Compared to:


CA Value
(4.7%)
The regional value is compared to the California state value.
US Value
(6.6%)
The regional value is compared to the national value.
Trend
This comparison measures the indicator’s values over multiple time periods.<br>The Mann-Kendall Test for Statistical Significance is used to evaluate the trend<br>over 4 to 10 periods of measure, subject to data availability and comparability.
County: Mendocino
Community / Domestic Violence & Abuse
Value
Compared to:
County: Mendocino Domestic Violence Calls
County: Mendocino Domestic Violence Calls
3.6
Calls per 1,000 population 18-69
(2022)
Compared to:
CA Value
(6.4)
The regional value is compared to the California state value.
Prior Value
(9.1)
Prior Value compares a measured value with the previously measured value. Confidence intervals were not taken into account in determining the direction of the comparison.
Trend
This comparison measures the indicator’s values over multiple time periods.<br>The Mann-Kendall Test for Statistical Significance is used to evaluate the trend<br>over 4 to 10 periods of measure, subject to data availability and comparability.
County: Mendocino
Community / Public Safety
Value
Compared to:
County: Mendocino Age-Adjusted Death Rate due to Motor Vehicle Traffic Collisions
County: Mendocino Age-Adjusted Death Rate due to Motor Vehicle Traffic Collisions
24.6
Deaths per 100,000 population
(2020-2022)
Compared to:
CA Counties
The distribution is based on data from 57 California counties.
CA Value
(11.5)
The regional value is compared to the California state value.
US Value
(12.0 in 2020)
The regional value is compared to the national value. The source for the national value is Centers for Disease Control and Prevention
Prior Value
(28.6)
Prior Value compares a measured value with the previously measured value. Confidence intervals were taken into account in determining the direction of the comparison.
Trend
This comparison measures the indicator’s values over multiple time periods.<br>The Mann-Kendall Test for Statistical Significance is used to evaluate the trend<br>over 4 to 10 periods of measure, subject to data availability and comparability.
HP 2030 Target
(10.1)
County: Mendocino Alcohol-Impaired Driving Deaths
County: Mendocino Alcohol-Impaired Driving Deaths
31.6%
Percent of driving deaths with alcohol involvement
(2017-2021)
Compared to:
CA Counties
The distribution is based on data from 58 California counties.
U.S. Counties
The distribution is based on data from 3,116 U.S. counties and county equivalents.
CA Value
(26.7%)
The regional value is compared to the California state value.
US Value
(26.3%)
The regional value is compared to the national value.
Prior Value
(34.3%)
Prior Value compares a measured value with the previously measured value. Confidence intervals were taken into account in determining the direction of the comparison.
Trend
This comparison measures the indicator’s values over multiple time periods.<br>The Mann-Kendall Test for Statistical Significance is used to evaluate the trend<br>over 4 to 10 periods of measure, subject to data availability and comparability.
County: Mendocino Bicycle-Involved Collision Rate
County: Mendocino Bicycle-Involved Collision Rate
0.0
Collisions per 100,000 population
(2023)
Compared to:
CA Counties
(2022)
The distribution is based on data from 58 California counties.
CA Value
(0.3)
The regional value is compared to the California state value.
Prior Value
(15.6)
Prior Value compares a measured value with the previously measured value. Confidence intervals were not taken into account in determining the direction of the comparison.
Trend
This comparison measures the indicator’s values over multiple time periods.<br>The Mann-Kendall Test for Statistical Significance is used to evaluate the trend<br>over 4 to 10 periods of measure, subject to data availability and comparability.
County: Mendocino Death Rate due to Motor Vehicle Collisions
County: Mendocino Death Rate due to Motor Vehicle Collisions
21.8
Deaths per 100,000 population
(2015-2021)
Compared to:
CA Counties
The distribution is based on data from 56 California counties.
U.S. Counties
The distribution is based on data from 2,688 U.S. counties and county equivalents.
CA Value
(10.4)
The regional value is compared to the California state value.
US Value
(12.0)
The regional value is compared to the national value.
County: Mendocino
Community / Social Environment
Value
Compared to:
County: Mendocino Children in Single-Parent Households
County: Mendocino Children in Single-Parent Households
28.7%
(2018-2022)
Compared to:
CA Counties
The distribution is based on data from 58 California counties.
U.S. Counties
The distribution is based on data from 3,132 U.S. counties and county equivalents.
CA Value
(22.4%)
The regional value is compared to the California state value.
US Value
(24.9%)
The regional value is compared to the national value.
Trend
This comparison measures the indicator’s values over multiple time periods.<br>The Mann-Kendall Test for Statistical Significance is used to evaluate the trend<br>over 4 to 10 periods of measure, subject to data availability and comparability.
County: Mendocino People 65+ Living Alone
County: Mendocino People 65+ Living Alone
30.8%
(2018-2022)
Compared to:
CA Counties
The distribution is based on data from 58 California counties.
U.S. Counties
The distribution is based on data from 3,133 U.S. counties and county equivalents.
CA Value
(22.0%)
The regional value is compared to the California state value.
US Value
(26.4%)
The regional value is compared to the national value.
Trend
This comparison measures the indicator’s values over multiple time periods.<br>The Mann-Kendall Test for Statistical Significance is used to evaluate the trend<br>over 4 to 10 periods of measure, subject to data availability and comparability.
County: Mendocino People 65+ Living Alone (Count)
County: Mendocino People 65+ Living Alone (Count)
6,535
People
(2018-2022)
Compared to:

Trend
This comparison measures the indicator’s values over multiple time periods.<br>The Mann-Kendall Test for Statistical Significance is used to evaluate the trend<br>over 4 to 10 periods of measure, subject to data availability and comparability.
County: Mendocino Social Associations
County: Mendocino Social Associations
7.3
Membership associations per 10,000 population
(2021)
Compared to:


CA Counties
The distribution is based on data from 58 California counties.
U.S. Counties
The distribution is based on data from 3,141 U.S. counties and county equivalents.
CA Value
(6.0)
The regional value is compared to the California state value.
US Value
(9.1)
The regional value is compared to the national value.
Prior Value
(7.6)
Prior Value compares a measured value with the previously measured value. Confidence intervals were not taken into account in determining the direction of the comparison.
Trend
This comparison measures the indicator’s values over multiple time periods.<br>The Mann-Kendall Test for Statistical Significance is used to evaluate the trend<br>over 4 to 10 periods of measure, subject to data availability and comparability.
County: Mendocino Substantiated Child Abuse Rate
County: Mendocino Substantiated Child Abuse Rate
17.5
Cases per 1,000 children
(2022)
Compared to:
CA Value
(6.1)
The regional value is compared to the California state value.
US Value
(8.2 in 2021)
The regional value is compared to the national value. The source for the national value is Children's Bureau
Prior Value
(14.2)
Prior Value compares a measured value with the previously measured value. Confidence intervals were not taken into account in determining the direction of the comparison.
Trend
This comparison measures the indicator’s values over multiple time periods.<br>The Mann-Kendall Test for Statistical Significance is used to evaluate the trend<br>over 4 to 10 periods of measure, subject to data availability and comparability.
HP 2030 Target
(8.7)
County: Mendocino
Community / Transportation
Value
Compared to:
County: Mendocino Mean Travel Time to Work
County: Mendocino Mean Travel Time to Work
21.7
Minutes
(2018-2022)
Compared to:
CA Counties
The distribution is based on data from 58 California counties.
U.S. Counties
The distribution is based on data from 3,131 U.S. counties and county equivalents.
CA Value
(29.2)
The regional value is compared to the California state value.
US Value
(26.7)
The regional value is compared to the national value.
Trend
This comparison measures the indicator’s values over multiple time periods.<br>The Mann-Kendall Test for Statistical Significance is used to evaluate the trend<br>over 4 to 10 periods of measure, subject to data availability and comparability.
County: Mendocino Solo Drivers with a Long Commute
County: Mendocino Solo Drivers with a Long Commute
24.9%
(2018-2022)
Compared to:
CA Counties
The distribution is based on data from 58 California counties.
U.S. Counties
The distribution is based on data from 3,141 U.S. counties and county equivalents.
CA Value
(41.6%)
The regional value is compared to the California state value.
US Value
(36.4%)
The regional value is compared to the national value.
Prior Value
(23.3%)
Prior Value compares a measured value with the previously measured value. Confidence intervals were taken into account in determining the direction of the comparison.
Trend
This comparison measures the indicator’s values over multiple time periods.<br>The Mann-Kendall Test for Statistical Significance is used to evaluate the trend<br>over 4 to 10 periods of measure, subject to data availability and comparability.
County: Mendocino Workers Commuting by Public Transportation
County: Mendocino Workers Commuting by Public Transportation
0.3%
(2018-2022)
Compared to:
CA Counties
The distribution is based on data from 58 California counties.
CA Value
(3.6%)
The regional value is compared to the California state value.
US Value
(3.8%)
The regional value is compared to the national value.
Trend
This comparison measures the indicator’s values over multiple time periods.<br>The Mann-Kendall Test for Statistical Significance is used to evaluate the trend<br>over 4 to 10 periods of measure, subject to data availability and comparability.
HP 2030 Target
(5.3%)
County: Mendocino Workers who Drive Alone to Work
County: Mendocino Workers who Drive Alone to Work
72.5%
(2018-2022)
Compared to:
CA Counties
The distribution is based on data from 58 California counties.
U.S. Counties
The distribution is based on data from 3,133 U.S. counties and county equivalents.
CA Value
(68.4%)
The regional value is compared to the California state value.
US Value
(71.7%)
The regional value is compared to the national value.
Trend
This comparison measures the indicator’s values over multiple time periods.<br>The Mann-Kendall Test for Statistical Significance is used to evaluate the trend<br>over 4 to 10 periods of measure, subject to data availability and comparability.
County: Mendocino
Economy / Employment
Value
Compared to:
County: Mendocino Employer Establishments
County: Mendocino Employer Establishments
2,437
Number of Establishments
(2021)
Compared to:
Prior Value
(2,432)
Prior Value compares a measured value with the previously measured value. Confidence intervals were not taken into account in determining the direction of the comparison.
Trend
This comparison measures the indicator’s values over multiple time periods.<br>The Mann-Kendall Test for Statistical Significance is used to evaluate the trend<br>over 4 to 10 periods of measure, subject to data availability and comparability.
County: Mendocino Female Population 16+ in Civilian Labor Force
County: Mendocino Female Population 16+ in Civilian Labor Force
53.0%
(2018-2022)
Compared to:
CA Counties
The distribution is based on data from 58 California counties.
U.S. Counties
The distribution is based on data from 3,133 U.S. counties and county equivalents.
CA Value
(57.8%)
The regional value is compared to the California state value.
US Value
(58.5%)
The regional value is compared to the national value.
Trend
This comparison measures the indicator’s values over multiple time periods.<br>The Mann-Kendall Test for Statistical Significance is used to evaluate the trend<br>over 4 to 10 periods of measure, subject to data availability and comparability.
County: Mendocino Population 16+ in Civilian Labor Force
County: Mendocino Population 16+ in Civilian Labor Force
51.3%
(2018-2022)
Compared to:
CA Counties
The distribution is based on data from 58 California counties.
U.S. Counties
The distribution is based on data from 3,133 U.S. counties and county equivalents.
CA Value
(59.3%)
The regional value is compared to the California state value.
US Value
(59.6%)
The regional value is compared to the national value.
Trend
This comparison measures the indicator’s values over multiple time periods.<br>The Mann-Kendall Test for Statistical Significance is used to evaluate the trend<br>over 4 to 10 periods of measure, subject to data availability and comparability.
County: Mendocino Size of Labor Force
County: Mendocino Size of Labor Force
37,477
Persons
(May 2024)
Compared to:
Prior Value
(37,358)
Prior Value compares a measured value with the previously measured value. Confidence intervals were not taken into account in determining the direction of the comparison.
Trend
This comparison measures the indicator’s values over multiple time periods.<br>The Mann-Kendall Test for Statistical Significance is used to evaluate the trend<br>over 4 to 10 periods of measure, subject to data availability and comparability.
County: Mendocino Total Employment
County: Mendocino Total Employment
22,081
Paid Employees
(2021)
Compared to:

Prior Value
(23,335)
Prior Value compares a measured value with the previously measured value. Confidence intervals were not taken into account in determining the direction of the comparison.
Trend
This comparison measures the indicator’s values over multiple time periods.<br>The Mann-Kendall Test for Statistical Significance is used to evaluate the trend<br>over 4 to 10 periods of measure, subject to data availability and comparability.
County: Mendocino Total Employment Change
County: Mendocino Total Employment Change
-5.4%
(2020-2021)
Compared to:
CA Counties
The distribution is based on data from 58 California counties.
U.S. Counties
The distribution is based on data from 3,140 U.S. counties and county equivalents.
CA Value
(-5.6%)
The regional value is compared to the California state value.
US Value
(-4.3%)
The regional value is compared to the national value.
Prior Value
(-0.9%)
Prior Value compares a measured value with the previously measured value. Confidence intervals were not taken into account in determining the direction of the comparison.
Trend
This comparison measures the indicator’s values over multiple time periods.<br>The Mann-Kendall Test for Statistical Significance is used to evaluate the trend<br>over 4 to 10 periods of measure, subject to data availability and comparability.
County: Mendocino Unemployed Veterans
County: Mendocino Unemployed Veterans
6.6%
(2018-2022)
Compared to:
CA Counties
The distribution is based on data from 58 California counties.
U.S. Counties
The distribution is based on data from 3,128 U.S. counties and county equivalents.
CA Value
(4.3%)
The regional value is compared to the California state value.
US Value
(3.2%)
The regional value is compared to the national value.
Trend
This comparison measures the indicator’s values over multiple time periods.<br>The Mann-Kendall Test for Statistical Significance is used to evaluate the trend<br>over 4 to 10 periods of measure, subject to data availability and comparability.
County: Mendocino Unemployed Workers in Civilian Labor Force
County: Mendocino Unemployed Workers in Civilian Labor Force
4.1%
(May 2024)
Compared to:
CA Counties
The distribution is based on data from 58 California counties.
U.S. Counties
The distribution is based on non-seasonally-adjusted data from 3,140 U.S. counties and county equivalents.
CA Value
(4.6%)
The regional value is compared to the California state value.
US Value
(3.7%)
The regional value is compared to the national value.
Prior Value
(5.1%)
Prior Value compares a measured value with the previously measured value. Confidence intervals were not taken into account in determining the direction of the comparison.
Trend
This comparison measures the indicator’s values over multiple time periods.<br>The Mann-Kendall Test for Statistical Significance is used to evaluate the trend<br>over 4 to 10 periods of measure, subject to data availability and comparability.
County: Mendocino
Economy / Food Insecurity
Value
Compared to:
County: Mendocino Adults Receiving Food Stamp Benefits
County: Mendocino Adults Receiving Food Stamp Benefits
36.7%
(2022)
Compared to:
CA Counties
The distribution is based on data from 58 California counties.
CA Value
(31.7%)
The regional value is compared to the California state value.
Prior Value
(28.3%)
Prior Value compares a measured value with the previously measured value. Confidence intervals were taken into account in determining the direction of the comparison.
County: Mendocino Child Food Insecurity Rate
County: Mendocino Child Food Insecurity Rate
21.9%
(2022)
Compared to:
CA Counties
The distribution is based on data from 58 California counties.
U.S. Counties
The distribution is based on data from 3,133 U.S. counties and county equivalents.
CA Value
(16.9%)
The regional value is compared to the California state value.
US Value
(18.5%)
The regional value is compared to the national value.
Prior Value
(16.8%)
Prior Value compares a measured value with the previously measured value. Confidence intervals were not taken into account in determining the direction of the comparison.
Trend
This comparison measures the indicator’s values over multiple time periods.<br>The Mann-Kendall Test for Statistical Significance is used to evaluate the trend<br>over 4 to 10 periods of measure, subject to data availability and comparability.
County: Mendocino Food Insecure Children Likely Ineligible for Assistance
County: Mendocino Food Insecure Children Likely Ineligible for Assistance
29%
(2022)
Compared to:
CA Counties
The distribution is based on data from 58 California counties.
U.S. Counties
The distribution is based on data from 3,131 U.S. counties and county equivalents.
CA Value
(35%)
The regional value is compared to the California state value.
US Value
(25% in 2021)
The regional value is compared to the national value.
Prior Value
(23%)
Prior Value compares a measured value with the previously measured value. Confidence intervals were not taken into account in determining the direction of the comparison.
Trend
This comparison measures the indicator’s values over multiple time periods.<br>The Mann-Kendall Test for Statistical Significance is used to evaluate the trend<br>over 4 to 10 periods of measure, subject to data availability and comparability.
County: Mendocino Food Insecurity Rate
County: Mendocino Food Insecurity Rate
15.1%
(2022)
Compared to:
CA Counties
The distribution is based on data from 58 California counties.
U.S. Counties
The distribution is based on data from 3,133 U.S. counties and county equivalents.
CA Value
(12.6%)
The regional value is compared to the California state value.
US Value
(13.5%)
The regional value is compared to the national value.
Prior Value
(12.8%)
Prior Value compares a measured value with the previously measured value. Confidence intervals were not taken into account in determining the direction of the comparison.
Trend
This comparison measures the indicator’s values over multiple time periods.<br>The Mann-Kendall Test for Statistical Significance is used to evaluate the trend<br>over 4 to 10 periods of measure, subject to data availability and comparability.
County: Mendocino Households Receiving SNAP with Children
County: Mendocino Households Receiving SNAP with Children
40.4%
(2018-2022)
Compared to:
CA Value
(53.1%)
The regional value is compared to the California state value.
US Value
(47.9%)
The regional value is compared to the national value.
Trend
This comparison measures the indicator’s values over multiple time periods.<br>The Mann-Kendall Test for Statistical Significance is used to evaluate the trend<br>over 4 to 10 periods of measure, subject to data availability and comparability.
County: Mendocino Households Receiving SNAP with Children (Count)
County: Mendocino Households Receiving SNAP with Children (Count)
1,828
Households
(2018-2022)
Compared to:
Trend
This comparison measures the indicator’s values over multiple time periods.<br>The Mann-Kendall Test for Statistical Significance is used to evaluate the trend<br>over 4 to 10 periods of measure, subject to data availability and comparability.
County: Mendocino Projected Child Food Insecurity Rate
County: Mendocino Projected Child Food Insecurity Rate
22.3%
(2021)
Compared to:
CA Counties
The distribution is based on data from 58 California counties.
U.S. Counties
The distribution is based on data from 3,142 U.S. counties and county equivalents.
CA Value
(16.8%)
The regional value is compared to the California state value.
Prior Value
(30.1%)
Prior Value compares a measured value with the previously measured value. Confidence intervals were not taken into account in determining the direction of the comparison.
County: Mendocino Projected Food Insecurity Rate
County: Mendocino Projected Food Insecurity Rate
15.6%
(2021)
Compared to:
CA Counties
The distribution is based on data from 58 California counties.
U.S. Counties
The distribution is based on data from 3,142 U.S. counties and county equivalents.
CA Value
(12.1%)
The regional value is compared to the California state value.
Prior Value
(19.4%)
Prior Value compares a measured value with the previously measured value. Confidence intervals were not taken into account in determining the direction of the comparison.
County: Mendocino Students Eligible for the Free Lunch Program
County: Mendocino Students Eligible for the Free Lunch Program
64.9%
(2022-2023)
Compared to:
CA Counties
The distribution is based on data from 58 California counties.
U.S. Counties
The distribution is based on data from 2,710 U.S. counties and county equivalents.
CA Value
(52.6%)
The regional value is compared to the California state value.
US Value
(42.8%)
The regional value is compared to the national value.
Prior Value
(65.1%)
Prior Value compares a measured value with the previously measured value. Confidence intervals were not taken into account in determining the direction of the comparison.
Trend
This comparison measures the indicator’s values over multiple time periods.<br>The Mann-Kendall Test for Statistical Significance is used to evaluate the trend<br>over 4 to 10 periods of measure, subject to data availability and comparability.
County: Mendocino
Economy / Government Assistance
Value
Compared to:
County: Mendocino Households with Cash Public Assistance Income
County: Mendocino Households with Cash Public Assistance Income
3.7%
(2018-2022)
Compared to:
CA Counties
The distribution is based on data from 57 California counties.
U.S. Counties
The distribution is based on data from 2,923 U.S. counties and county equivalents.
CA Value
(3.7%)
The regional value is compared to the California state value.
US Value
(2.7%)
The regional value is compared to the national value.
Trend
This comparison measures the indicator’s values over multiple time periods.<br>The Mann-Kendall Test for Statistical Significance is used to evaluate the trend<br>over 4 to 10 periods of measure, subject to data availability and comparability.
County: Mendocino
Economy / Homelessness
Value
Compared to:
45
Persons
(2022)
Compared to:
Prior Value
(21)
Prior Value compares a measured value with the previously measured value. Confidence intervals were not taken into account in determining the direction of the comparison.
Trend
This comparison measures the indicator’s values over multiple time periods.<br>The Mann-Kendall Test for Statistical Significance is used to evaluate the trend<br>over 4 to 10 periods of measure, subject to data availability and comparability.
County: Mendocino Point-in-Time Count of Veterans Experiencing Homelessness
County: Mendocino Point-in-Time Count of Veterans Experiencing Homelessness
19
Persons
(2022)
Compared to:
Prior Value
(13)
Prior Value compares a measured value with the previously measured value. Confidence intervals were not taken into account in determining the direction of the comparison.
Trend
This comparison measures the indicator’s values over multiple time periods.<br>The Mann-Kendall Test for Statistical Significance is used to evaluate the trend<br>over 4 to 10 periods of measure, subject to data availability and comparability.
County: Mendocino Sheltered Homeless
County: Mendocino Sheltered Homeless
270
Persons
(2022)
Compared to:
Prior Value
(318)
Prior Value compares a measured value with the previously measured value. Confidence intervals were not taken into account in determining the direction of the comparison.
Trend
This comparison measures the indicator’s values over multiple time periods.<br>The Mann-Kendall Test for Statistical Significance is used to evaluate the trend<br>over 4 to 10 periods of measure, subject to data availability and comparability.
County: Mendocino Total Homeless Population
County: Mendocino Total Homeless Population
830
Persons
(2022)
Compared to:
Prior Value
(318)
Prior Value compares a measured value with the previously measured value. Confidence intervals were not taken into account in determining the direction of the comparison.
Trend
This comparison measures the indicator’s values over multiple time periods.<br>The Mann-Kendall Test for Statistical Significance is used to evaluate the trend<br>over 4 to 10 periods of measure, subject to data availability and comparability.
County: Mendocino Unsheltered Homeless
County: Mendocino Unsheltered Homeless
560
Persons
(2022)
Compared to:
Prior Value
Prior Value compares a measured value with the previously measured value. Confidence intervals were not taken into account in determining the direction of the comparison.
Trend
This comparison measures the indicator’s values over multiple time periods.<br>The Mann-Kendall Test for Statistical Significance is used to evaluate the trend<br>over 4 to 10 periods of measure, subject to data availability and comparability.
County: Mendocino
Economy / Housing & Homes
Value
Compared to:
County: Mendocino Homeowner Vacancy Rate
County: Mendocino Homeowner Vacancy Rate
0.9%
(2018-2022)
Compared to:
CA Counties
The distribution is based on data from 58 California counties.
U.S. Counties
The distribution is based on data from 3,132 U.S. counties and county equivalents.
CA Value
(0.9%)
The regional value is compared to the California state value.
US Value
(1.1%)
The regional value is compared to the national value.
Trend
This comparison measures the indicator’s values over multiple time periods.<br>The Mann-Kendall Test for Statistical Significance is used to evaluate the trend<br>over 4 to 10 periods of measure, subject to data availability and comparability.
County: Mendocino Homeownership
County: Mendocino Homeownership
50.9%
(2018-2022)
Compared to:
CA Value
(51.4%)
The regional value is compared to the California state value.
US Value
(57.8%)
The regional value is compared to the national value.
Trend
This comparison measures the indicator’s values over multiple time periods.<br>The Mann-Kendall Test for Statistical Significance is used to evaluate the trend<br>over 4 to 10 periods of measure, subject to data availability and comparability.
County: Mendocino Median Household Gross Rent
County: Mendocino Median Household Gross Rent
$1,240
(2018-2022)
Compared to:
CA Counties
The distribution is based on data from 57 California counties.
CA Value
($1,856)
The regional value is compared to the California state value.
US Value
($1,268)
The regional value is compared to the national value.
Trend
This comparison measures the indicator’s values over multiple time periods.<br>The Mann-Kendall Test for Statistical Significance is used to evaluate the trend<br>over 4 to 10 periods of measure, subject to data availability and comparability.
County: Mendocino Median Monthly Owner Costs for Households without a Mortgage
County: Mendocino Median Monthly Owner Costs for Households without a Mortgage
$670
(2018-2022)
Compared to:
CA Counties
The distribution is based on data from 58 California counties.
CA Value
($732)
The regional value is compared to the California state value.
US Value
($584)
The regional value is compared to the national value.
Trend
This comparison measures the indicator’s values over multiple time periods.<br>The Mann-Kendall Test for Statistical Significance is used to evaluate the trend<br>over 4 to 10 periods of measure, subject to data availability and comparability.
County: Mendocino Mortgaged Owners Median Monthly Household Costs
County: Mendocino Mortgaged Owners Median Monthly Household Costs
$2,214
(2018-2022)
Compared to:
CA Counties
The distribution is based on data from 54 California counties.
CA Value
($2,759)
The regional value is compared to the California state value.
US Value
($1,828)
The regional value is compared to the national value.
Trend
This comparison measures the indicator’s values over multiple time periods.<br>The Mann-Kendall Test for Statistical Significance is used to evaluate the trend<br>over 4 to 10 periods of measure, subject to data availability and comparability.
County: Mendocino Mortgaged Owners Spending 30% or More of Household Income on Housing
County: Mendocino Mortgaged Owners Spending 30% or More of Household Income on Housing
47.1%
(2022)
Compared to:
CA Counties
The distribution is based on data from 42 California counties.
U.S. Counties
The distribution is based on data from 828 U.S. counties and county equivalents.
CA Value
(37.6%)
The regional value is compared to the California state value.
US Value
(27.8%)
The regional value is compared to the national value.
Prior Value
(29.8%)
Prior Value compares a measured value with the previously measured value. Confidence intervals were not taken into account in determining the direction of the comparison.
Trend
This comparison measures the indicator’s values over multiple time periods.<br>The Mann-Kendall Test for Statistical Significance is used to evaluate the trend<br>over 4 to 10 periods of measure, subject to data availability and comparability.
HP 2030 Target
(25.5%)
County: Mendocino Overcrowded Households
County: Mendocino Overcrowded Households
4.9%
(2018-2022)
Compared to:
CA Counties
The distribution is based on data from 58 California counties.
CA Value
(8.2%)
The regional value is compared to the California state value.
US Value
(3.4%)
The regional value is compared to the national value.
Trend
This comparison measures the indicator’s values over multiple time periods.<br>The Mann-Kendall Test for Statistical Significance is used to evaluate the trend<br>over 4 to 10 periods of measure, subject to data availability and comparability.
County: Mendocino Renters Spending 30% or More of Household Income on Rent
County: Mendocino Renters Spending 30% or More of Household Income on Rent
55.3%
(2018-2022)
Compared to:
CA Counties
The distribution is based on data from 58 California counties.
U.S. Counties
The distribution is based on data from 3,132 U.S. counties and county equivalents.
CA Value
(54.4%)
The regional value is compared to the California state value.
US Value
(49.9%)
The regional value is compared to the national value.
Trend
This comparison measures the indicator’s values over multiple time periods.<br>The Mann-Kendall Test for Statistical Significance is used to evaluate the trend<br>over 4 to 10 periods of measure, subject to data availability and comparability.
HP 2030 Target
(25.5%)
County: Mendocino Severe Housing Problems
County: Mendocino Severe Housing Problems
23.7%
(2016-2020)
Compared to:
CA Counties
The distribution is based on data from 58 California counties.
U.S. Counties
The distribution is based on data from 3,141 U.S. counties and county equivalents.
CA Value
(25.7%)
The regional value is compared to the California state value.
US Value
(16.7%)
The regional value is compared to the national value.
Prior Value
(25.0%)
Prior Value compares a measured value with the previously measured value. Confidence intervals were taken into account in determining the direction of the comparison.
Trend
This comparison measures the indicator’s values over multiple time periods.<br>The Mann-Kendall Test for Statistical Significance is used to evaluate the trend<br>over 4 to 10 periods of measure, subject to data availability and comparability.
County: Mendocino
Economy / Income
Value
Compared to:
County: Mendocino Income Inequality
County: Mendocino Income Inequality
0.481
(2018-2022)
Compared to:
CA Counties
The distribution is based on data from 58 California counties.
U.S. Counties
The distribution is based on data from 3,133 U.S. counties and county equivalents.
CA Value
(0.490)
The regional value is compared to the California state value.
US Value
(0.483)
The regional value is compared to the national value.
Trend
This comparison measures the indicator’s values over multiple time periods.<br>The Mann-Kendall Test for Statistical Significance is used to evaluate the trend<br>over 4 to 10 periods of measure, subject to data availability and comparability.
County: Mendocino Median Household Income
County: Mendocino Median Household Income
$61,335
(2018-2022)
Compared to:
CA Counties
The distribution is based on data from 58 California counties.
U.S. Counties
The distribution is based on data from 3,132 U.S. counties and county equivalents.
CA Value
($91,905)
The regional value is compared to the California state value.
US Value
($75,149)
The regional value is compared to the national value.
Trend
This comparison measures the indicator’s values over multiple time periods.<br>The Mann-Kendall Test for Statistical Significance is used to evaluate the trend<br>over 4 to 10 periods of measure, subject to data availability and comparability.
County: Mendocino Per Capita Income
County: Mendocino Per Capita Income
$34,977
(2018-2022)
Compared to:
CA Counties
The distribution is based on data from 58 California counties.
U.S. Counties
The distribution is based on data from 3,133 U.S. counties and county equivalents.
CA Value
($45,591)
The regional value is compared to the California state value.
US Value
($41,261)
The regional value is compared to the national value.
Trend
This comparison measures the indicator’s values over multiple time periods.<br>The Mann-Kendall Test for Statistical Significance is used to evaluate the trend<br>over 4 to 10 periods of measure, subject to data availability and comparability.
County: Mendocino
Economy / Poverty
Value
Compared to:
County: Mendocino Children Living Below Poverty Level
County: Mendocino Children Living Below Poverty Level
20.6%
(2018-2022)
Compared to:
CA Counties
The distribution is based on data from 58 California counties.
U.S. Counties
The distribution is based on data from 3,132 U.S. counties and county equivalents.
CA Value
(15.6%)
The regional value is compared to the California state value.
US Value
(16.7%)
The regional value is compared to the national value.
Trend
This comparison measures the indicator’s values over multiple time periods.<br>The Mann-Kendall Test for Statistical Significance is used to evaluate the trend<br>over 4 to 10 periods of measure, subject to data availability and comparability.
County: Mendocino Families Living Below Poverty Level
County: Mendocino Families Living Below Poverty Level
11.5%
(2018-2022)
Compared to:
CA Counties
The distribution is based on data from 58 California counties.
U.S. Counties
The distribution is based on data from 3,104 U.S. counties and county equivalents.
CA Value
(8.5%)
The regional value is compared to the California state value.
US Value
(8.8%)
The regional value is compared to the national value.
Trend
This comparison measures the indicator’s values over multiple time periods.<br>The Mann-Kendall Test for Statistical Significance is used to evaluate the trend<br>over 4 to 10 periods of measure, subject to data availability and comparability.
County: Mendocino People 65+ Living Below Poverty Level
County: Mendocino People 65+ Living Below Poverty Level
12.9%
(2018-2022)
Compared to:
CA Counties
The distribution is based on data from 58 California counties.
U.S. Counties
The distribution is based on data from 3,133 U.S. counties and county equivalents.
CA Value
(11.0%)
The regional value is compared to the California state value.
US Value
(10.0%)
The regional value is compared to the national value.
Trend
This comparison measures the indicator’s values over multiple time periods.<br>The Mann-Kendall Test for Statistical Significance is used to evaluate the trend<br>over 4 to 10 periods of measure, subject to data availability and comparability.
County: Mendocino People 65+ Living Below Poverty Level (Count)
County: Mendocino People 65+ Living Below Poverty Level (Count)
2,702
People
(2018-2022)
Compared to:
Trend
This comparison measures the indicator’s values over multiple time periods.<br>The Mann-Kendall Test for Statistical Significance is used to evaluate the trend<br>over 4 to 10 periods of measure, subject to data availability and comparability.
County: Mendocino People Living 200% Above Poverty Level
County: Mendocino People Living 200% Above Poverty Level
64.4%
(2018-2022)
Compared to:
CA Counties
The distribution is based on data from 58 California counties.
U.S. Counties
The distribution is based on data from 3,133 U.S. counties and county equivalents.
CA Value
(72.0%)
The regional value is compared to the California state value.
US Value
(71.2%)
The regional value is compared to the national value.
Trend
This comparison measures the indicator’s values over multiple time periods.<br>The Mann-Kendall Test for Statistical Significance is used to evaluate the trend<br>over 4 to 10 periods of measure, subject to data availability and comparability.
County: Mendocino People Living Below Poverty Level
County: Mendocino People Living Below Poverty Level
16.2%
(2018-2022)
Compared to:
CA Counties
The distribution is based on data from 58 California counties.
U.S. Counties
The distribution is based on data from 3,133 U.S. counties and county equivalents.
CA Value
(12.1%)
The regional value is compared to the California state value.
US Value
(12.5%)
The regional value is compared to the national value.
Trend
This comparison measures the indicator’s values over multiple time periods.<br>The Mann-Kendall Test for Statistical Significance is used to evaluate the trend<br>over 4 to 10 periods of measure, subject to data availability and comparability.
HP 2030 Target
(8.0%)
County: Mendocino Veterans Living Below Poverty Level
County: Mendocino Veterans Living Below Poverty Level
13.9%
(2018-2022)
Compared to:
CA Counties
The distribution is based on data from 58 California counties.
U.S. Counties
The distribution is based on data from 3,132 U.S. counties and county equivalents.
CA Value
(7.7%)
The regional value is compared to the California state value.
US Value
(7.0%)
The regional value is compared to the national value.
Trend
This comparison measures the indicator’s values over multiple time periods.<br>The Mann-Kendall Test for Statistical Significance is used to evaluate the trend<br>over 4 to 10 periods of measure, subject to data availability and comparability.
County: Mendocino Youth not in School or Working
County: Mendocino Youth not in School or Working
2.1%
(2018-2022)
Compared to:
CA Counties
The distribution is based on data from 58 California counties.
U.S. Counties
The distribution is based on data from 3,130 U.S. counties and county equivalents.
CA Value
(1.5%)
The regional value is compared to the California state value.
US Value
(1.8%)
The regional value is compared to the national value.
Trend
This comparison measures the indicator’s values over multiple time periods.<br>The Mann-Kendall Test for Statistical Significance is used to evaluate the trend<br>over 4 to 10 periods of measure, subject to data availability and comparability.
County: Mendocino
Education / Childcare & Early Childhood Education
Value
Compared to:
County: Mendocino Child Care Centers
County: Mendocino Child Care Centers
8.5
Per 1,000 population under age 5
(2022)
Compared to:
CA Counties
The distribution is based on data from 58 California counties.
CA Value
(8.1)
The regional value is compared to the California state value.
US Value
(7.0)
The regional value is compared to the national value.
Prior Value
(7.4)
Prior Value compares a measured value with the previously measured value. Confidence intervals were not taken into account in determining the direction of the comparison.
County: Mendocino
Education / Educational Attainment
Value
Compared to:
County: Mendocino People 25+ with a Bachelor's Degree or Higher
County: Mendocino People 25+ with a Bachelor's Degree or Higher
24.0%
(2018-2022)
Compared to:
CA Counties
The distribution is based on data from 58 California counties.
U.S. Counties
The distribution is based on data from 3,133 U.S. counties and county equivalents.
CA Value
(35.9%)
The regional value is compared to the California state value.
US Value
(34.3%)
The regional value is compared to the national value.
Trend
This comparison measures the indicator’s values over multiple time periods.<br>The Mann-Kendall Test for Statistical Significance is used to evaluate the trend<br>over 4 to 10 periods of measure, subject to data availability and comparability.
County: Mendocino People 25+ with a High School Diploma or Higher
County: Mendocino People 25+ with a High School Diploma or Higher
86.8%
(2018-2022)
Compared to:
CA Counties
The distribution is based on data from 58 California counties.
U.S. Counties
The distribution is based on data from 3,133 U.S. counties and county equivalents.
CA Value
(84.4%)
The regional value is compared to the California state value.
US Value
(89.1%)
The regional value is compared to the national value.
Trend
This comparison measures the indicator’s values over multiple time periods.<br>The Mann-Kendall Test for Statistical Significance is used to evaluate the trend<br>over 4 to 10 periods of measure, subject to data availability and comparability.
County: Mendocino Veterans with a High School Diploma or Higher
County: Mendocino Veterans with a High School Diploma or Higher
97.3%
(2018-2022)
Compared to:
CA Counties
The distribution is based on data from 58 California counties.
U.S. Counties
The distribution is based on data from 3,132 U.S. counties and county equivalents.
CA Value
(95.1%)
The regional value is compared to the California state value.
US Value
(95.0%)
The regional value is compared to the national value.
Trend
This comparison measures the indicator’s values over multiple time periods.<br>The Mann-Kendall Test for Statistical Significance is used to evaluate the trend<br>over 4 to 10 periods of measure, subject to data availability and comparability.
County: Mendocino
Education / School Environment
Value
Compared to:
County: Mendocino Student-to-Teacher Ratio
County: Mendocino Student-to-Teacher Ratio
18.1
Students per teacher
(2022-2023)
Compared to:
CA Counties
The distribution is based on data from 58 California counties.
U.S. Counties
The distribution is based on data from 3,125 U.S. counties and county equivalents.
CA Value
(21.9)
The regional value is compared to the California state value.
US Value
(15.4)
The regional value is compared to the national value.
Prior Value
(18.5)
Prior Value compares a measured value with the previously measured value. Confidence intervals were not taken into account in determining the direction of the comparison.
Trend
This comparison measures the indicator’s values over multiple time periods.<br>The Mann-Kendall Test for Statistical Significance is used to evaluate the trend<br>over 4 to 10 periods of measure, subject to data availability and comparability.
County: Mendocino
Education / Student Performance K-12
Value
Compared to:
County: Mendocino 11th Grade Students Proficient in English/Language Arts
County: Mendocino 11th Grade Students Proficient in English/Language Arts
41.5%
(2022)
Compared to:
CA Counties
The distribution is based on data from 57 California counties.
CA Value
(54.8%)
The regional value is compared to the California state value.
Prior Value
(55.6%)
Prior Value compares a measured value with the previously measured value. Confidence intervals were not taken into account in determining the direction of the comparison.
Trend
This comparison measures the indicator’s values over multiple time periods.<br>The Mann-Kendall Test for Statistical Significance is used to evaluate the trend<br>over 4 to 10 periods of measure, subject to data availability and comparability.
County: Mendocino 11th Grade Students Proficient in Math
County: Mendocino 11th Grade Students Proficient in Math
16.5%
(2022)
Compared to:
CA Counties
The distribution is based on data from 57 California counties.
CA Value
(27.0%)
The regional value is compared to the California state value.
Prior Value
(22.3%)
Prior Value compares a measured value with the previously measured value. Confidence intervals were not taken into account in determining the direction of the comparison.
Trend
This comparison measures the indicator’s values over multiple time periods.<br>The Mann-Kendall Test for Statistical Significance is used to evaluate the trend<br>over 4 to 10 periods of measure, subject to data availability and comparability.
County: Mendocino 3rd Grade Students Proficient in English/Language Arts
County: Mendocino 3rd Grade Students Proficient in English/Language Arts
26%
(2022)
Compared to:
CA Counties
The distribution is based on data from 57 California counties.
CA Value
(42%)
The regional value is compared to the California state value.
Prior Value
(35%)
Prior Value compares a measured value with the previously measured value. Confidence intervals were not taken into account in determining the direction of the comparison.
Trend
This comparison measures the indicator’s values over multiple time periods.<br>The Mann-Kendall Test for Statistical Significance is used to evaluate the trend<br>over 4 to 10 periods of measure, subject to data availability and comparability.
County: Mendocino 3rd Grade Students Proficient in Math
County: Mendocino 3rd Grade Students Proficient in Math
29%
(2022)
Compared to:
CA Counties
The distribution is based on data from 57 California counties.
CA Value
(44%)
The regional value is compared to the California state value.
Prior Value
(26%)
Prior Value compares a measured value with the previously measured value. Confidence intervals were not taken into account in determining the direction of the comparison.
Trend
This comparison measures the indicator’s values over multiple time periods.<br>The Mann-Kendall Test for Statistical Significance is used to evaluate the trend<br>over 4 to 10 periods of measure, subject to data availability and comparability.
County: Mendocino 4th Grade Students Proficient in English/Language Arts
County: Mendocino 4th Grade Students Proficient in English/Language Arts
29%
(2022)
Compared to:
CA Counties
The distribution is based on data from 57 California counties.
CA Value
(44%)
The regional value is compared to the California state value.
Prior Value
(35%)
Prior Value compares a measured value with the previously measured value. Confidence intervals were not taken into account in determining the direction of the comparison.
Trend
This comparison measures the indicator’s values over multiple time periods.<br>The Mann-Kendall Test for Statistical Significance is used to evaluate the trend<br>over 4 to 10 periods of measure, subject to data availability and comparability.
County: Mendocino 4th Grade Students Proficient in Math
County: Mendocino 4th Grade Students Proficient in Math
24%
(2022)
Compared to:
CA Counties
The distribution is based on data from 57 California counties.
CA Value
(38%)
The regional value is compared to the California state value.
Prior Value
(32%)
Prior Value compares a measured value with the previously measured value. Confidence intervals were not taken into account in determining the direction of the comparison.
Trend
This comparison measures the indicator’s values over multiple time periods.<br>The Mann-Kendall Test for Statistical Significance is used to evaluate the trend<br>over 4 to 10 periods of measure, subject to data availability and comparability.
County: Mendocino 5th Grade Students Proficient in English/Language Arts
County: Mendocino 5th Grade Students Proficient in English/Language Arts
28.3%
(2022)
Compared to:
CA Counties
The distribution is based on data from 57 California counties.
CA Value
(47.1%)
The regional value is compared to the California state value.
Prior Value
(33.9%)
Prior Value compares a measured value with the previously measured value. Confidence intervals were not taken into account in determining the direction of the comparison.
Trend
This comparison measures the indicator’s values over multiple time periods.<br>The Mann-Kendall Test for Statistical Significance is used to evaluate the trend<br>over 4 to 10 periods of measure, subject to data availability and comparability.
County: Mendocino 5th Grade Students Proficient in Math
County: Mendocino 5th Grade Students Proficient in Math
16.8%
(2022)
Compared to:
CA Counties
The distribution is based on data from 57 California counties.
CA Value
(31.6%)
The regional value is compared to the California state value.
Prior Value
(11.9%)
Prior Value compares a measured value with the previously measured value. Confidence intervals were not taken into account in determining the direction of the comparison.
Trend
This comparison measures the indicator’s values over multiple time periods.<br>The Mann-Kendall Test for Statistical Significance is used to evaluate the trend<br>over 4 to 10 periods of measure, subject to data availability and comparability.
County: Mendocino 6th Grade Students Proficient in English/Language Arts
County: Mendocino 6th Grade Students Proficient in English/Language Arts
31.1%
(2022)
Compared to:
CA Counties
The distribution is based on data from 57 California counties.
CA Value
(45.1%)
The regional value is compared to the California state value.
Prior Value
(19.1%)
Prior Value compares a measured value with the previously measured value. Confidence intervals were not taken into account in determining the direction of the comparison.
Trend
This comparison measures the indicator’s values over multiple time periods.<br>The Mann-Kendall Test for Statistical Significance is used to evaluate the trend<br>over 4 to 10 periods of measure, subject to data availability and comparability.
County: Mendocino 6th Grade Students Proficient in Math
County: Mendocino 6th Grade Students Proficient in Math
18.2%
(2022)
Compared to:
CA Counties
The distribution is based on data from 57 California counties.
CA Value
(32.5%)
The regional value is compared to the California state value.
Prior Value
(9.7%)
Prior Value compares a measured value with the previously measured value. Confidence intervals were not taken into account in determining the direction of the comparison.
Trend
This comparison measures the indicator’s values over multiple time periods.<br>The Mann-Kendall Test for Statistical Significance is used to evaluate the trend<br>over 4 to 10 periods of measure, subject to data availability and comparability.
County: Mendocino 7th Grade Students Proficient in English/Language Arts
County: Mendocino 7th Grade Students Proficient in English/Language Arts
35.9%
(2022)
Compared to:
CA Counties
The distribution is based on data from 57 California counties.
CA Value
(49.2%)
The regional value is compared to the California state value.
Prior Value
(33.5%)
Prior Value compares a measured value with the previously measured value. Confidence intervals were not taken into account in determining the direction of the comparison.
Trend
This comparison measures the indicator’s values over multiple time periods.<br>The Mann-Kendall Test for Statistical Significance is used to evaluate the trend<br>over 4 to 10 periods of measure, subject to data availability and comparability.
County: Mendocino 7th Grade Students Proficient in Math
County: Mendocino 7th Grade Students Proficient in Math
19.4%
(2022)
Compared to:
CA Counties
The distribution is based on data from 57 California counties.
CA Value
(32.0%)
The regional value is compared to the California state value.
Prior Value
(15.1%)
Prior Value compares a measured value with the previously measured value. Confidence intervals were not taken into account in determining the direction of the comparison.
Trend
This comparison measures the indicator’s values over multiple time periods.<br>The Mann-Kendall Test for Statistical Significance is used to evaluate the trend<br>over 4 to 10 periods of measure, subject to data availability and comparability.
County: Mendocino 8th Grade Students Proficient in English/Language Arts
County: Mendocino 8th Grade Students Proficient in English/Language Arts
30.6%
(2022)
Compared to:
CA Counties
The distribution is based on data from 57 California counties.
CA Value
(46.6%)
The regional value is compared to the California state value.
Prior Value
(30.5%)
Prior Value compares a measured value with the previously measured value. Confidence intervals were not taken into account in determining the direction of the comparison.
Trend
This comparison measures the indicator’s values over multiple time periods.<br>The Mann-Kendall Test for Statistical Significance is used to evaluate the trend<br>over 4 to 10 periods of measure, subject to data availability and comparability.
County: Mendocino 8th Grade Students Proficient in Math
County: Mendocino 8th Grade Students Proficient in Math
15.4%
(2022)
Compared to:
CA Counties
The distribution is based on data from 57 California counties.
CA Value
(29.2%)
The regional value is compared to the California state value.
Prior Value
(13.2%)
Prior Value compares a measured value with the previously measured value. Confidence intervals were not taken into account in determining the direction of the comparison.
Trend
This comparison measures the indicator’s values over multiple time periods.<br>The Mann-Kendall Test for Statistical Significance is used to evaluate the trend<br>over 4 to 10 periods of measure, subject to data availability and comparability.
County: Mendocino High School Graduation
County: Mendocino High School Graduation
87.4%
(2022-2023)
Compared to:
CA Counties
The distribution is based on data from 57 California counties.
CA Value
(86.2%)
The regional value is compared to the California state value.
US Value
(86.5% in 2020)
The regional value is compared to the national value. The source for the national value is National Center for Education Statistics
Prior Value
(84.0%)
Prior Value compares a measured value with the previously measured value. Confidence intervals were not taken into account in determining the direction of the comparison.
Trend
This comparison measures the indicator’s values over multiple time periods.<br>The Mann-Kendall Test for Statistical Significance is used to evaluate the trend<br>over 4 to 10 periods of measure, subject to data availability and comparability.
HP 2030 Target
(90.7%)
County: Mendocino
Environmental Health / Air
Value
Compared to:
County: Mendocino Air Pollution due to Particulate Matter
County: Mendocino Air Pollution due to Particulate Matter
6.0
Micrograms per cubic meter
(2019)
Compared to:
CA Counties
The distribution is based on data from 58 California counties.
U.S. Counties
The distribution is based on data from 3,115 U.S. counties and county equivalents.
CA Value
(7.1)
The regional value is compared to the California state value.
US Value
(7.4)
The regional value is compared to the national value.
Prior Value
(11.4)
Prior Value compares a measured value with the previously measured value. Confidence intervals were not taken into account in determining the direction of the comparison.
Trend
This comparison measures the indicator’s values over multiple time periods.<br>The Mann-Kendall Test for Statistical Significance is used to evaluate the trend<br>over 4 to 10 periods of measure, subject to data availability and comparability.
County: Mendocino Annual Ozone Air Quality
County: Mendocino Annual Ozone Air Quality
1
(2020-2022)
Compared to:
Air Quality Index
The American Lung Association (ALA) assigns grades A-F to counties (A=1; B=2; C=3; D=4; F=5), based on average annual number of days that ozone levels exceeded U.S. standards during the three year measurement period. The five-point grading scale was used for the distribution (Green = <2; Yellow = 2 - 3; Red = >3). The air quality data is collected by the EPA and summarized by the ALA.
Prior Value
(1)
Prior Value compares a measured value with the previously measured value. Confidence intervals were not taken into account in determining the direction of the comparison.
Trend
This comparison measures the indicator’s values over multiple time periods.<br>The Mann-Kendall Test for Statistical Significance is used to evaluate the trend<br>over 4 to 10 periods of measure, subject to data availability and comparability.
County: Mendocino Annual Particle Pollution
County: Mendocino Annual Particle Pollution
5
(2020-2022)
Compared to:
Air Quality Index
The American Lung Association (ALA) assigns grades A-F to counties (A=1; B=2; C=3; D=4; F=5), based on average annual number of days that particle pollution levels exceeded U.S. standards during the three year measurement period. The five-point grading scale was used for the distribution (Green = <2; Yellow = 2 - 3; Red = >3). The air quality data is collected by the EPA and summarized by the ALA.
Prior Value
(5)
Prior Value compares a measured value with the previously measured value. Confidence intervals were not taken into account in determining the direction of the comparison.
Trend
This comparison measures the indicator’s values over multiple time periods.<br>The Mann-Kendall Test for Statistical Significance is used to evaluate the trend<br>over 4 to 10 periods of measure, subject to data availability and comparability.
County: Mendocino
Environmental Health / Built Environment
Value
Compared to:
County: Mendocino Access to Exercise Opportunities
County: Mendocino Access to Exercise Opportunities
66.7%
(2024)
Compared to:
CA Counties
The distribution is based on data from 58 California counties.
U.S. Counties
The distribution is based on data from 3,096 U.S. counties and county equivalents.
CA Value
(94.2%)
The regional value is compared to the California state value.
US Value
(84.1%)
The regional value is compared to the national value.
Prior Value
(65.9%)
Prior Value compares a measured value with the previously measured value. Confidence intervals were not taken into account in determining the direction of the comparison.
County: Mendocino Access to Parks
County: Mendocino Access to Parks
45.4%
(2020)
Compared to:
CA Counties
The distribution is based on data from 58 California counties.
U.S. Counties
The distribution is based on data from 3,141 U.S. counties and county equivalents.
CA Value
(79.5%)
The regional value is compared to the California state value.
Prior Value
(42.1%)
Prior Value compares a measured value with the previously measured value. Confidence intervals were not taken into account in determining the direction of the comparison.
County: Mendocino Food Environment Index
County: Mendocino Food Environment Index
7.5
(2024)
Compared to:
CA Counties
The distribution is based on data from 58 California counties.
U.S. Counties
The distribution is based on data from 3,108 U.S. counties and county equivalents.
CA Value
(8.6)
The regional value is compared to the California state value.
US Value
(7.7)
The regional value is compared to the national value.
Prior Value
(7.4)
Prior Value compares a measured value with the previously measured value. Confidence intervals were not taken into account in determining the direction of the comparison.
Trend
This comparison measures the indicator’s values over multiple time periods.<br>The Mann-Kendall Test for Statistical Significance is used to evaluate the trend<br>over 4 to 10 periods of measure, subject to data availability and comparability.
County: Mendocino Liquor Store Density
County: Mendocino Liquor Store Density
8.8
Stores per 100,000 population
(2021)
Compared to:
CA Counties
The distribution is based on data from 44 California counties.
U.S. Counties
The distribution is based on data from 1,477 U.S. counties and county equivalents.
CA Value
(11.0)
The regional value is compared to the California state value.
US Value
(10.7)
The regional value is compared to the national value.
Prior Value
(8.8)
Prior Value compares a measured value with the previously measured value. Confidence intervals were not taken into account in determining the direction of the comparison.
Trend
This comparison measures the indicator’s values over multiple time periods.<br>The Mann-Kendall Test for Statistical Significance is used to evaluate the trend<br>over 4 to 10 periods of measure, subject to data availability and comparability.
County: Mendocino Proximity to Highways
County: Mendocino Proximity to Highways
2.7%
(2020)
Compared to:
CA Counties
The distribution is based on data from 58 California counties.
U.S. Counties
The distribution is based on data from 3,141 U.S. counties and county equivalents.
CA Value
(5.8%)
The regional value is compared to the California state value.
Prior Value
(3.3%)
Prior Value compares a measured value with the previously measured value. Confidence intervals were not taken into account in determining the direction of the comparison.
County: Mendocino
Environmental Health / Weather & Climate
Value
Compared to:
County: Mendocino Daily Dose of UV Irradiance
County: Mendocino Daily Dose of UV Irradiance
4,477
Joule per square meter
(2020)
Compared to:
CA Counties
The distribution is based on data from 58 California counties.
CA Value
(4,541)
The regional value is compared to the California state value.
Prior Value
(4,114)
Prior Value compares a measured value with the previously measured value. Confidence intervals were not taken into account in determining the direction of the comparison.
Trend
This comparison measures the indicator’s values over multiple time periods.<br>The Mann-Kendall Test for Statistical Significance is used to evaluate the trend<br>over 4 to 10 periods of measure, subject to data availability and comparability.
County: Mendocino Number of Extreme Heat Days
County: Mendocino Number of Extreme Heat Days
9
Days
(2022)
Compared to:
Prior Value
(29)
Prior Value compares a measured value with the previously measured value. Confidence intervals were not taken into account in determining the direction of the comparison.
Trend
This comparison measures the indicator’s values over multiple time periods.<br>The Mann-Kendall Test for Statistical Significance is used to evaluate the trend<br>over 4 to 10 periods of measure, subject to data availability and comparability.
County: Mendocino Number of Extreme Heat Events
County: Mendocino Number of Extreme Heat Events
6
Events
(2022)
Compared to:
Prior Value
(22)
Prior Value compares a measured value with the previously measured value. Confidence intervals were not taken into account in determining the direction of the comparison.
Trend
This comparison measures the indicator’s values over multiple time periods.<br>The Mann-Kendall Test for Statistical Significance is used to evaluate the trend<br>over 4 to 10 periods of measure, subject to data availability and comparability.
County: Mendocino Number of Extreme Precipitation Days
County: Mendocino Number of Extreme Precipitation Days
9
Days
(2023)
Compared to:
Prior Value
(9)
Prior Value compares a measured value with the previously measured value. Confidence intervals were not taken into account in determining the direction of the comparison.
Trend
This comparison measures the indicator’s values over multiple time periods.<br>The Mann-Kendall Test for Statistical Significance is used to evaluate the trend<br>over 4 to 10 periods of measure, subject to data availability and comparability.
County: Mendocino Weeks of Moderate Drought or Worse
County: Mendocino Weeks of Moderate Drought or Worse
47
Weeks per year
(2021)
Compared to:
Prior Value
(43)
Prior Value compares a measured value with the previously measured value. Confidence intervals were not taken into account in determining the direction of the comparison.
Trend
This comparison measures the indicator’s values over multiple time periods.<br>The Mann-Kendall Test for Statistical Significance is used to evaluate the trend<br>over 4 to 10 periods of measure, subject to data availability and comparability.
