Summer Product Releases 2018
Zero-based Axis
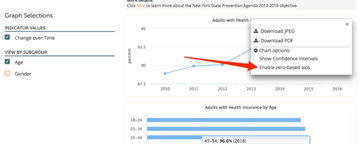
Users are now able to enable a zero-based axis by selecting the hamburger icon in the top right corner of charts. This will change the chart so the y-axis will begin at zero.
Administrators also have the ability to control the default behavior site-wide. If enabled, graphs will always include zero in the axis. If not, the axis bounds are chosen automatically. Regardless of this setting, the axis configuration can be toggled using the hamburger menu that appears on charts.

Find a Location
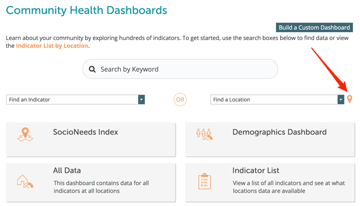
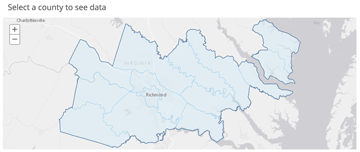
On the Community Health Dashboards page, users are now able to use a map to select a location to find data. Click the icon next to the “Find a Location” dropdown to view a map of all available locations. Selecting a location in the map will bring you to a dashboard for the selected location.

Demographic Variables
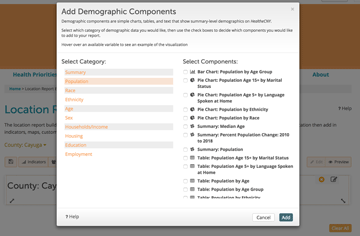
The Location Report Builder tool now includes all Claritas demographic variables. To view the available demographic components, go to the Location Report Builder on your site and select Demographics.

Custom Dashboards
The “Build a Custom Dashboard” button has moved! You will now find this option alongside the other curated dashboards on the Community Health Dashboards landing page.

SocioNeeds Index Chart
The SocioNeeds Index now includes a downloadable chart below the map.

New Map Navigation Tile
The new Map Navigation Tile allows users to view indicator or demographic data by selecting a location on a map.


